
HP XP P9000 Performance Advisor Software v5.5 User Guide (T1789-96337, Februrary 2013)

To refresh the list, click Refresh. To close the dialog box, click Close.
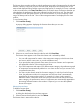
Creating reports for favorite charts
In addition to viewing your favorite charts, you can also generate, save, or schedule reports for
the favorite charts. The reports contain the performance graphs for the combination of components
and metrics saved in your favorite charts. You can also select the duration for which you want to
view the performance graphs of the components.
Generating or saving reports for favorite charts
NOTE:
• To create a report, it is mandatory that you provide the report name, array model, and report
type.
• The Report Name, Customer Name, Consultant Name, and Array Location are pre-populated
in the respective fields if you have already configured them as common settings on the Email
Settings screen. For more information, see “Configuring email and SNMP settings” (page 73).
If you do not want these default descriptions, modify the respective fields. However, the
changes are applicable only for the current report that you generate, save, or schedule.
• Each chart can display performance data points for a maximum of 50 components in the
report generated for the favorite charts.
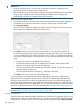
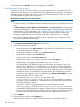
To generate or save a report for a favorite chart:
1. Click Reports+Create/Schedule Reports in the left pane.
2. Select or enter the following details:
• Name of the report in the Report Name box. The name must not be less than 2 characters
or exceed 80 characters in length.
• Name of the customer or company in the Customer Name box.
• Name of the consultant in the Consultant box.
• Location for the array in the Array Location box.
• The format in which you want to view the report, from the File Type list.
The following are the supported file formats: HTML, PDF, and RTF.
The HTML format is the default file type for any report that you generate or save. The
report is always provided in a compressed file (.zip) format as an email attachment.
However, if you select a PDF or RTF file type, choose to receive a normal report file or
a compressed file as the email attachment. If you have saved the report in HP XP P9000
Performance Advisor or scheduled the report generation, the corresponding record for
the report is also displayed on the View Reports screen (Reports+View Reports). You can
further select the report you want to view.
By default, the SMTP_Rpt_Compress is set to TRUE in the
serverparameters.properties file. Any PDF or DOC file type that you generate
or save for a report is attached as a compressed file in the email notification sent by HP
XP P9000 Performance Advisor.
To receive a normal (uncompressed) report as an email attachment, set the
SMTP_Rpt_Compress to FALSE in the serverparameters.properties file. Then,
restart the HP XP P9000 Performance Advisor Tomcat service on your management station.
Any PDF or DOC file type that you generate or save for a report is provided as a normal
file attachment in the email notification sent by HP XP P9000 Performance Advisor.
3. Select Template.
4. Select the favorite chart from the Template list.
All the favorite charts that you created on the Charts screen are available in this list.
280 Using charts