
HP XP P9000 Performance Advisor Software v5.5 User Guide (T1789-96337, Februrary 2013)
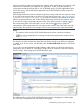

In addition, the following details are also displayed:
• RAID group table:
DKA Pair: Displays the DKA pair associated with the particular LDEV.◦
◦ RG: Displays the RAID group number associated with the particular LDEV.
◦ Pool ID: Displays the ThP pool ID.
NOTE: For XP disk arrays prior to the XP24000 Disk Array, NA is displayed under Pool
ID, as the ThP cannot be configured on XP disk arrays prior to the XP24000 Disk Array.
In the following scenarios (applicable for the P9000 disk arrays, such as the P9500 and
the XP disk arrays, such as the XP24000, XP20000, and SVS200):
– If the RAID group is contributing to only one ThP pool, the respective ThP pool ID is
displayed.
– If the RAID group is contributing to more than one ThP pool, the first ThP pool ID is
displayed. The corresponding RAID group is marked with * to indicate that the RAID
group is contributing to more than one ThP pool.
– If the RAID group is not contributing to any ThP pool, is displayed under Pool ID.
• Port table:
Port ID: Displays the port associated with the particular LDEV.
The port type, such as Fibre, Ficon, Escon, or FCoE (applicable only for P9000 disk
arrays) is also displayed beside the port ID.
◦
◦ CHA MP: Displays the MP associated with the port.
The details of the partner port that is associated with the same MP is also displayed. The
partner port record appears in grey. When you plot the usage graphs for these ports
(primary and partner ports), you will be able to analyze whether the partner port is
overloading the MP that is also associated with the primary port.
IMPORTANT: The CHA MP data is not applicable for the P9000 disk arrays.
If your application is associated with the XP disk arrays, appropriate status icons are displayed
for the following based on the corresponding component utilization:
• MP Util (%)
• Write Pending (%)
• DKA Util (%)
• RG Util (%)
If your application is associated with the P9000 disk arrays, appropriate status icons are displayed
for the following based on the corresponding component utilization:
• Write Pending (%)
• RG Util (%)
• MP Blade Util (%)
NOTE: The DKA Util (%) metric is not applicable for the P9000 disk arrays.
These status icons can be ( , , or ) and derived based on the threshold values that you set on
the Threshold Setting screen. For more information on the status icons, see “XP/P9000 array health”
332 Troubleshooting issues for components associated with applications