
HP XP P9000 Performance Advisor Software v5.5 User Guide (T1789-96337, Februrary 2013)
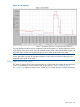
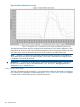
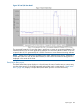
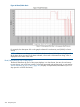
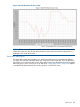
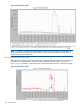
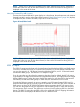
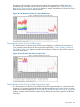
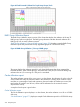

Figure 42 Read/Write Detail
NOTE: If there are no data points available for the dates selected, blank chart is displayed. If
all the data values are zero for the dates selected, a chart with a horizontal line along X axis is
displayed in the center of the chart.
Max/Min Frontend Port IOPS report
The Max/Min Frontend Port IOPS report displays in a chart format, the total maximum and minimum
frontend port I/O operations per second over the entire data collection period. “Read/Write
Detail” (page 366) displays a sample Max/Min Frontend Port IOPS report for a P9500 Disk Array.
Figure 43 Read/Write Detail
366 Sample reports