
HP XP P9000 Performance Advisor Software v5.5 User Guide (T1789-96337, Februrary 2013)
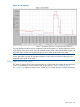
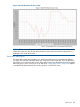
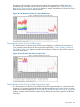

throughput of the hardware. The maximum throughput varies depending on RAID level, disk
mechanism type, and other factors such as the size of the individual I/Os. “Total Backend I/O
Rate First Top 8 Array Groups” (page 369) displays a sample Total Backend I/O Rate First Top 8
RAID Groups report for the XP1024 Disk Array.
Figure 46 Total Backend I/O Rate First Top 8 RAID Groups
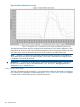
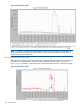
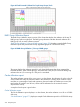
Total Frontend I/O Rate First Top 8 LDEVs report
The Total Frontend I/O Rate First Top 8 LDEVs report displays in a chart format, the number of
I/Os operations performed by the first set of busiest eight LDEVs. “Total Frontend I/O Rate First
Top 8 Ldevs” (page 369) displays a sample Total Frontend I/O Rate First Top 8 LDEVs report for
the XP1024 Disk Array.
Figure 47 Total Frontend I/O Rate First Top 8 Ldevs
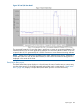
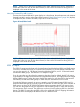
Total Frontend I/O Rate First Top 8 RAID Groups/Pools report
The Total Frontend I/O Rate First Top 8 RAID Groups/Pools report displays in a chart format, the
number of I/O operations performed by the eight busiest RAID groups or pools. Pools can either
be the ThP pool or the snapshot pool. “Total Frontend I/O Rate First Top 8 Array Groups” (page 370)
displays a sample Total Frontend I/O Rate First Top 8 RAID Groups/Pools report for the XP1024
Disk Array.
Report types 369