HP XP P9000 Performance Advisor Software User Guide Abstract This document describes how to use the HP XP P9000 Performance Advisor Software product and includes information about user tasks and troubleshooting. This document is intended for users and HP service providers who have knowledge of the HP XP P9000 Performance Advisor and P9000 disk arrays hardware, software, and storage systems. For the latest information about this product, see the HP XP P9000 Performance Advisor Software Release Notes.
© Copyright 2014 Hewlett-Packard Development Company, L.P. Confidential computer software. Valid license from HP required for possession, use or copying. Consistent with FAR 12.211 and 12.212, Commercial Computer Software, Computer Software Documentation, and Technical Data for Commercial Items are licensed to the U.S. Government under vendor's standard commercial license. The information contained herein is subject to change without notice.
Contents 1 Introduction to HP XP P9000 Performance Advisor........................................10 Overview..............................................................................................................................10 2 Working with the HP XP P9000 Performance Advisor GUI.............................11 Introduction............................................................................................................................11 Title bar.......................................
Stopping performance data collection schedules....................................................................66 Restarting performance data collection schedules...................................................................67 Deleting performance data collection schedules.....................................................................68 Setting the java heap size values.........................................................................................
Configuring notification and monitoring settings.......................................................................117 Filtering records based on metrics and alarm status..............................................................117 Setting threshold level.......................................................................................................118 Configuring alarm notifications..........................................................................................
Viewing Smart and ThP pools data for P9000 disk arrays..........................................................194 Viewing continuous access data for P9000 disk arrays..............................................................199 CA link status metrics.......................................................................................................202 Viewing 10 busiest LDEVs and Ports........................................................................................
Deleting favorite charts............................................................................................279 Creating reports for favorite charts................................................................................279 Printing charts.............................................................................................................281 Changing the Chart Work Area layout...........................................................................
Viewing performance or usage data for components............................................................328 Viewing data for prominent set of metrics.......................................................................331 Viewing data for additional metrics...............................................................................334 Viewing variations in the LDEV response time......................................................................335 Plotting charts.................................
ACP utilization report.......................................................................................................374 ACP Utilization report..................................................................................................374 ACP Utilization by Hour of the Day report......................................................................375 CHIP utilization report......................................................................................................
1 Introduction to HP XP P9000 Performance Advisor Overview HP XP P9000 Performance Advisor Software collects, monitors, and displays the performance of XP and P9000 disk arrays. HP XP P9000 Performance Advisor collects performance data for individual components such as LDEV, CHIP/CHA, ACP/DKA, DKC, and MP blades (applicable for only P9000 disk arrays).
2 Working with the HP XP P9000 Performance Advisor GUI Introduction The HP XP P9000 Performance Advisor screen has the following sections: • Title bar • Left pane • Right pane The left pane and the title bar are common to all the HP XP P9000 Performance Advisor screens. The Dashboard screen appears soon after you log on to HP XP P9000 Performance Advisor. The main functionalities of HP XP P9000 Performance Advisor can be accessed using the respective links in the left pane.
• About: Click About to view the product part number, build, and version number. • Support: Click Support to view the HP XP P9000 Performance Advisor Support screen that provides links to download software for the following: ◦ Host agents ◦ CLUI ◦ HP XP P9000Watch ◦ HP XP P9000Sketch ◦ HP XP P9000Info You can also download the HP XP P9000 Performance Advisor documentation from the Support screen. IMPORTANT: The HP XP P9000Sketch and HP XP P9000Info were called XPSketch and XPInfo in the pre-5.
Right pane The right pane displays the screen based on the menu that you select in the left pane. You can select related options on these screens to achieve the desired output. A tool tip is provided for every screen element, which provides a brief description of the screen element. The right pane also displays the Chart Work Area for those screens that require viewing the performance graphs for selected components.
• Columns are sorted depending on the type of information that appears in the respective columns (alphabetical, numerical, or date related). For example, the Metric column on the Alarm History screen sorts in an alphabetical order. The Value column sorts based on the numbers first followed by the alphabets. Resizing columns To resize a column width in a table: 1. Place the cursor of your pointing device on the column separator. The pointer or cursor changes as shown in the following image. 2.
3 Managing licenses for XP and P9000 disk arrays This chapter discusses the following topics: • “Introduction” (page 15) • “Instant-on license on HP XP P9000 Performance Advisor installation” (page 18) • “Instant-on license expiration” (page 19) • “Grace period expiration” (page 20) • “HP XP P9000 Performance Advisor licenses” (page 21) • “Generating licenses” (page 29) • “Installing licenses” (page 30) • “Viewing aggregate License status” (page 32) • “Viewing status for individual licenses
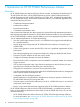
Table 1 License management during installation or upgrade (continued) Installation or upgrade License management Performance Advisor, after which a grace period of 60 days is provided. During the 120 days tenure or the 60 days grace period, you must generate a Permanent license at the HPAC license key website for each monitored XP or P9000 disk array, and install the license key on HP XP P9000 Performance Advisor.
Figure 2 License screen Screen elements Description Add New License File In this section, add the licenses (.dat files) that you generated at the HPAC license key website. License Status In this section, view the status of all the Permanent licenses installed on HP XP P9000 Performance Advisor. It displays the aggregate of all valid license capacities for each XP or P9000 disk array monitored by HP XP P9000 Performance Advisor.
Related Topics • “HP XP P9000 Performance Advisor licenses” (page 21) • “Generating licenses at the HPAC license key website” (page 29) • “Instant-on license on HP XP P9000 Performance Advisor installation” (page 18) • “Instant-on license expiration” (page 19) • “Grace period expiration” (page 20) Instant-on license on HP XP P9000 Performance Advisor installation The Instant-on license or the trial license is provided with every instance of HP XP P9000 Performance Advisor.
The Performance Advisor trial license expire on month, day, year. Please contact your HP Representative to purchase the requisite Performance Advisor licenses to avoid disruption of Performance Advisor services. Where, month, day, and year is calculated as 120 days from the date when you install HP XP P9000 Performance Advisor.
Screen elements Description Where, month, day, year refers to the date till when the grace period is valid. The above status message is also displayed on the Dashboard screen.
collect performance data for the current internal raw disk capacities of the monitored XP disk arrays or usable capacities of the monitored P9500 disk arrays. • Configured alarms, notifications, reports, charts, and all other functions continue to work. However, the generated report contains a warning message for license expiry at the beginning of the report. WARNING: License violation was detected for this array.
After installing a Permanent license, if you increase the internal raw disk capacity or the usable capacity beyond the Permanent licensed capacity, the existing Permanent license cannot be used. HP XP P9000 Performance Advisor considers it as a license capacity violation and initiates a grace period of 60 days for that XP or the P9000 disk array.
IMPORTANT: • Additional usable capacity refers to the usable capacity that is beyond the Permanent licensed capacity. • A Meter based Term license cannot be installed on multiple management stations. • Multiple Meter based Term licenses can be generated and installed on a management station. In such cases, the licenses are used successively.
Generate 1950TB-Days of Meter based Term license to monitor 50TB additional usable capacity for 39 days. The 1950TB-Days are derived based on the following calculation: 50TB * 39 days = 1950TB-Days of Meter based Term license The following figure illustrates the scenario described. So, 50TB usable capacity is monitored every day beginning December'10 for the next 39 days.
At the time of installing the Meter based Term license, if the usable capacity is within the Permanent licensed capacity, the installed TB-Days remain dormant till the usable capacity exceeds the Permanent licensed capacity. They are activated only after the Permanent license is completely used. The TB-Days are used for the duration when the usable capacity exceeds the installed Permanent licensed capacity and the exceeded capacity can be managed by the installed TB-Days.
Consider that the usable capacity exceeds the 50TB Permanent licensed capacity by 10TB in the first half of 12/03/2010. As a result, the 90TB-Days are activated and HP XP P9000 Performance Advisor uses 10TB-Days, and updates the following fields after 1:00 PM on the same day. On 12/03/2010: Column Headings - License Status section Description License Capacity Displays 50TB, +80TB-Days This is because, 10TB-Days are used on 12/03/2010 to monitor the additional 10TB usable capacity on that day.
Column Headings - License Status section Description Zero days, as there are no TB-Days to use. License Status Displays Capacity Insufficient. End Date Displays Expired. The License Capacity continues to display every day reduction in TB-Days till 02/08/2011 (60th day). The remaining fields listed in the above table remain the same.
• Term (Days): 9 • End Date: 12/10/2010 Nine days count from 12/02/2010 If 85.5TB is used during the first half of 12/03/2010 and no additional TB-Days are used for the rest of the day, HP XP P9000 Performance Advisor uses 86TB-Days and considers the 0.5 days as one day.
4. 5. 6. If the usable capacity rises beyond the 25TB Permanent licensed capacity on 11/30/2010 and 3.5TB is used on the same day, HP XP P9000 Performance Advisor considers 4TB-Days. If there has been no activity from 11/30/2010 till 12/28/2010, the remaining 8TB-Days are not used. If 4TB is used on 12/29/2010 followed by another 4TB on 12/30/2010, HP XP P9000 Performance Advisor considers 4TB-Days on each day, and the 8TB-Days are completely used by 12/30/2010.
5. Provide the following details on the Array information input screen: • Enter the Array DKC serial number, which is a five digit number, such as 10900, 53036. • Select the Hardware platform from the list. The supported P9000 disk array models, such as the P9500 and the XP disk array models, such as XP24000, XP20000, XP12000, XP10000, XP1024, and XP128 are displayed for selection. 6. Click Next >>. The Requestor Information screen appears. 7.
5. Click Add License. CAUTION: After the licenses are installed, do not modify the date and time on the management station where HP XP P9000 Performance Advisor is installed. Modifying them may result in inaccurate configuration and performance collections. The following details are updated in the View License File Status section.
Related Topics • “Viewing aggregate License status” (page 32) • “Viewing status for individual licenses” (page 32) • “Removing licenses” (page 40) Viewing aggregate License status HP XP P9000 Performance Advisor maintains the following for an XP or a P9000 disk array, if you have generated and installed licenses for that disk array on HP XP P9000 Performance Advisor: • An aggregate of internal raw disk capacities in an XP disk array • An aggregate of usable capacities in a P9000 disk array If a Met
3. Click View Details. The View License Detail section appears. The following image shows the license details for 53036, which belongs to the P9500 Disk Array Type. In addition to the details displayed in the License Status section, the following details specific to the installed license appear in the View License Detail section: Screen elements Description Key Type Displays the license type.
Screen elements Description Licenses Available Displays the available license capacity. • If you select an XP disk array record, this column always displays the Installed License Capacity value. • If you select a P9000 disk array record whose usable capacity is monitored using only a Permanent license, this column displays the Installed License Capacity value. • In case of Meter based Term licenses: 1.
Screen elements Description Expired Date If you select an XP or a P9000 disk array record whose usable capacity is monitored using only a Permanent license, this column is blank as the Permanent license is for an unlimited duration. In case of Meter based Term licenses: • If you select a P9000 disk array record for which both the Permanent license and TB-Days of Meter based Term license are installed, and the installed TB-Days are dormant, this column is blank.
Exceeding Permanent licensed capacity and grace period When the internal raw disk capacity of an XP disk array or the usable capacity of a P9000 disk array exceeds the Permanent licensed capacity, HP XP P9000 Performance Advisor switches to the grace period of 60 days for that particular disk array. The License Status for such XP or P9000 disk arrays displays Capacity Insufficient in the View License Status section.
• ◦ Term (Days): N/A ◦ End Date: Never After 1:00 PM on 11/30/2010: ◦ License Capacity: 50TB, +100TB-Days Consider that 25TB-Days are used after installation.
Consider the following points: 1. A P9000 disk array has a usable capacity of 50TB. 2. A Permanent license is installed on 11/23/2010 to monitor the 50TB usable capacity. 3. Due to a surge in storage requests around 11/30/2010, another 10TB usable capacity is added for a duration of five days. 4. Because this is a short term unplanned request, it is addressed by installing 50TB-Days of Meter based Term license on 11/30/2010. 5.
5. As the usable capacity is beyond the Permanent licensed capacity, HP XP P9000 Performance Advisor uses the 100TB-Days of Meter based Term license. Based on the usable capacity consumed, HP XP P9000 Performance Advisor uses the appropriate TB-Days of Meter based Term license. Following are sample consumptions from day 1 to day 3: 6. • 11/30/2010: 51.5TB monitored using 52TB-Days • 12/01/2010: 20.3TB monitored using 21TB-Days • 12/02/2010: 24.
During a capacity violation phase, if you do one of the following: • Install a Permanent license for HP XP P9000 Performance Advisor to monitor the XP disk array. Install a Permanent license or appropriate TB-Days of Meter based Term license for HP XP P9000 Performance Advisor to monitor the P9000 disk array. • Reduce the internal raw disk capacity of the XP disk array or the usable capacity of the P9000 disk array to match the Permanent licensed capacity.
case, HP XP P9000 Performance Advisor considers it as capacity insufficient violation and enters a grace period for that disk array. You can install the required TB-Days of Meter based Term license to end the grace period. If the TB-Days count is negative, the removal of the Meter based Term license is not allowed.
4. Click Remove License(s). The Confirm Delete dialog box appears. 5. Click Yes. The message indicating the removal of the license appears on top of the Remove License dialog box. Once the Meter based Term Licenses are removed, you cannot install it again on the same management station. However, it can be installed on a different management station. The available capacity will be same as the license capacity of the Meter based Term license key.
4 Collecting configuration and performance data This chapter discusses the following topics: • “Introduction” (page 43) • “Configuring host information” (page 45) • “Configuration data” (page 48) • “Performance data” (page 56) Introduction HP XP P9000 Performance Advisor interacts with the XP and the P9000 disk arrays through hosts that have the operating system specific HP XP P9000 Performance Advisor host agents installed.
NOTE: • HP XP P9000 Performance Advisor also collects the real-time performance data from the XP and the P9000 disk arrays. For more information, see “Troubleshooting using real-time performance data from XP and P9000 disk arrays” (page 316). • To distinguish the external parity group from the normal parity group in case of an outband collection, the external parity group fb4 number is displayed between the range of 101 to 16484.
Screen elements Description Configuration Collection Displays the list of command device records in the Configuration Collection table. You can select a command device and perform a one-time configuration data collection, or schedule a configuration data collection for the corresponding XP or P9000 disk array. Performance Collection Displays the list of XP and P9000 disk array records in the Performance Collection table.
Related Topics • “Collecting configuration data” (page 51) • “Scheduling configuration data collection” (page 52) • “Performance data” (page 56) Requesting host agent updates Prerequisites Ensure that the following prerequisites are met: • Ensure that the version of the host agent installed on the host matches with the version of HP XP P9000 Performance Advisor installed on the management station.
4. Click Request Info. The Request Info button is enabled only when you select the host agents. Use the Shft or the Ctrl key to select multiple host agent records. The request is executed in the subsequent data collection cycle. Following is the sequence of events that occur for the selected host agent: a. HP XP P9000 Performance Advisor retrieves the updated information from the host agent. This may take a few minutes depending on the number of LDEVs that are exposed to the host agent.
4. Click Remove Host. The Remove Host button is enabled only when you select a host agent record. HP XP P9000 Performance Advisor deletes the host agent record and logs a confirmation on the Event Log screen. When you remove a host agent, information about the command devices and the following data for the XP and the P9000 disk arrays connected to the host agent are also removed.
Screen elements Description Array Displays the DKC number and the user-friendly name of the XP or the P9000 disk array. Host ID Displays the system name of the host. Port Displays the port that is configured to communicate data between the command device (on an XP or a P9000 disk array) and the associated host agent. Cmddev Displays the ID of the LDEV that is configured as a command device. DeviceFile Displays the device file for the command device.
The following are important notes applicable for both the one-time and scheduled configuration data collection: • Select only one command device for an XP or a P9000 disk array to perform the configuration data collection for that array. • When a configuration data collection is in progress for an XP or a P9000 disk array, do not initiate another configuration data collection for the same array.
Tasks you can perform under the Configuration Collection tab • “Collecting configuration data” (page 51) • “Scheduling configuration data collection” (page 52) One-time configuration data collection Prerequisites Ensure that the following prerequisites are met before you start the configuration data collection for the XP and the P9000 disk arrays.
: • The corresponding SVP IP address and RWC user name and password are displayed in the respective text boxes, if you already saved these credentials in HP XP P9000 Performance Advisor for the selected P9000 disk array. For more information on saving credentials, see “Registering the XP or P9000 disk array SVP IP address in HP XP P9000 Performance Advisor” (page 75).
1. Click Monitoring+Array View in the left pane. The Array View screen appears. 2. 3. Click the Configuration Collection tab. The Configuration Collection table displays the list of command device records for all the XP and the P9000 disk arrays that are monitored by HP XP P9000 Performance Advisor. Select the command device record corresponding to the XP or the P9000 disk array for which you want to collect the configuration data.
7. Based on the disk array that you selected, following are the further course of steps: If you selected an XP disk array and Outband mode of configuration data collection: : • Manually enter the SVP IP address in the SVP IP Address text box and proceed to next step to initiate the configuration data collection. If you already registered the XP disk array SVP with the respective management station, the corresponding SVP IP address is displayed in the SVP IP Address text box.
• “Filtering event records” (page 136) • “Configuring email and SNMP settings” (page 71) • “Starting real-time performance data collection” (page 319) • “Viewing performance summary” (page 174) • “Plotting charts” (page 233) Configuration collection schedules The following table describes the configuration collection schedules. Collection Schedule Description Hourly If the collection schedule is selected as Hourly, the Hourly Schedule If you create an hourly schedule list appears.
Collection Schedule Description Examples Deleting configuration data collection schedules To delete a configuration data collection schedule: 1. Click Monitoring+Array View in the left pane. The Array View screen appears. 2. 3. 4. Click the Configuration Collection tab. The Configuration Collection table displays the list of command device records for all the XP and the P9000 disk arrays that are monitored by HP XP P9000 Performance Advisor.
events. In case of performance data collection failure, the Event Log screen displays the failure messages. NOTE: If you plot performance graphs when the configuration data collection is in progress, there are gaps in the data points. These gaps indicate that the performance data is not collected during the configuration data collection time interval. • While creating a performance data collection schedule, you can select a command device that is mapped through two different ports.
collection is not limited to the number of LDEVs that the host station is mapped to use. If you set the collection rate too narrow (less than 5 minutes), it results in reduced responsiveness from the management station. • If you split the external RAID groups, RAID groups, ThP pools, and the snapshots into two schedules, you cannot see the Total I/O, Total MB/s, and the Total Tracks fields in the LDEV table.
Example use cases The following are the example use cases for understanding the split performance data collection schedules: 1 Scenario Activity One Activity Two2 1 • The first schedule contains all components • The RG components are removed, and only the associated with the DKC and Port component types. components associated with the DKC and Port It also includes some components associated with component types are saved in the first schedule. the RG component type.
Creating performance data collection schedules IMPORTANT: • Only one schedule can be created on a selected command device. For a better performance, select a maximum of two command devices that belong to different ports. • A schedule cannot be created for the same XP or P9000 disk array through two different host agents. • HP recommends that you should allow two minutes per 1,000 LDEVs for the management station to keep up with the collection.
performance data collection schedule that you are creating, HP XP P9000 Performance Advisor validates the following and displays appropriate error messages if the validations fail: 4. • If it is the first performance data collection schedule, HP XP P9000 Performance Advisor verifies if the configuration data is already available for that XP or P9000 disk array.
NOTE: • The THP Group(s), CA Journal Group(s), and the SNAP Group(s) component type lists are displayed only if the corresponding components are configured on the selected XP or the P9000 disk array. The External RG(s) component type list is displayed only if the external volumes are attached to the selected XP or the P9000 disk array. • Selecting a ThP, snapshot, or a continuous access journal volume also provides the respective volume pool information.
discovered components are added to the appropriate schedule without impacting the other components included in a performance data collection schedule. 10. Click Save for the changes to take effect. Click Cancel, if you do not want to configure a schedule for the current selection. Click Refresh to view the updated list of performance data schedules. The new schedule starts automatically.
• “Stopping performance data collection” (page 66) • “Deleting performance data collection schedule” (page 68) • “Starting real-time performance data collection” (page 319) Enabling performance collection schedules for automatic updates You can enable the performance data collection schedules to automatically collect the performance data for newly discovered RAID groups and ports.
Scenarios Automatic updates What happens... you can still enable Schedule 2 to receive automatic updates. Two schedules created (Schedule 1 and Schedule 2) Both Schedule 1 or Schedule 2 are The newly discovered RAID groups and disabled to receive automatic updates. ports are neither added to Schedule 1 or Schedule 2. Hence, you must edit the schedules manually to add or remove components in the existing list.
NOTE: • The Stagger Collection is shown as false, if you have not configured a staggered collection schedule. • The View button is enabled only when you select an XP or a P9000 disk array record under the Performance Collection tab.
2. 3. Click the Performance Data tab and select the XP or the P9000 disk array record for which you want to stop the performance data collection schedule. Click Stop. The Stop button is enabled only when you select an XP or a P9000 disk array record under the Performance Collection tab. A dialog box appears prompting you to confirm whether you want to stop the schedule. 4. Click OK. HP XP P9000 Performance Advisor stops the collection from the next collection cycle.
Deleting performance data collection schedules To delete a performance data collection schedule: 1. Click Monitoring+Array View in the left pane. The Array View screen appears. 2. 3. Click the Performance Data tab and select the XP or the P9000 disk array record for which you want to delete the associated performance data collection schedule. Click Delete. The Delete button is enabled only when you select an XP or a P9000 disk array record under the Performance Collection tab.
4. Enter the minimum and maximum java heap size values that are appropriate to your current setup. The Resize Heap tool stops the HP XP P9000 Performance Advisor Tomcat service to apply the configured java heap size values. The service is automatically restarted once the new values are set. Setting the heap size values for Windows and Unix host agents By default, the heap size value is set to Xmx1024M on a Windows or UNIX host agent.
5 Configuring common settings for HP XP P9000 Performance Advisor This chapter discusses the following topics: • “Introduction” (page 70) • “Configuring email and SNMP settings” (page 71) • “Setting time zone for management station” (page 77) • “Setting severity level” (page 76) • “Registering the XP or P9000 disk array SVP IP address in HP XP P9000 Performance Advisor” (page 75) • “Providing user-friendly names for XP and P9000 disk arrays” (page 74) In addition, this chapter also discusses the
IMPORTANT: You must log on to HP XP P9000 Performance Advisor as an administrator or a user with administrator privileges to perform the above-mentioned tasks. However, the administrator privileges are not required to manage the custom groups and the fabricated LDEV records. You can also configure the following specific settings: • Set the threshold limits (PA and DB Settings+Threshold Setting) and monitor the overall usage of the XP and the P9000 disk arrays on the Dashboard screen.
IMPORTANT: • The new email notification settings that you provide are automatically updated in the serverparameters.properties file. Hence, a manual reboot of the HP XP P9000 Performance Advisor management station is not required. • The Email Address is a mandatory field. Provide a valid destination email address that receives the email notifications when the alarms and reports are generated, or the performance data collection fails. For example, test1@xyz.
The default destination email address for receiving the alarm notifications is administrator@localhost • An appropriate subject text for the alarm email notifications. HP XP P9000 Performance Advisor uses the specified subject line as the default subject line for all the notifications that are dispatched when a component is performing beyond the set threshold limit. The default subject line is P9000 Alarm. • An appropriate title text for the Good Information alarm (recovery alarm) email notifications.
Trap not dispatched. It might be due to invalid IP address or server name, or the SNMP server is not accessible. 4. Click Save. A message appears to indicate that the settings are updated in the serverparameters.properties file. Click OK to start using HP XP P9000 Performance Advisor. If you click Cancel, the previous specified values are retained in the in the serverparameters.properties file and also displayed on the Email Settings screen.
Related Topics • “Collecting configuration data” (page 51) • “Scheduling configuration data collection” (page 52) • “Performance data” (page 56) Registering the XP or P9000 disk array SVP IP address in HP XP P9000 Performance Advisor You can register the SVP of an XP or a P9000 disk array with the respective management station that has HP XP P9000 Performance Advisor monitoring these disk arrays.
4. Click Register. The SVP IP address that you specify is registered with the management station. HP XP P9000 Performance Advisor automatically uses the SVP IP address every time you initiate an outband configuration data collection for the selected XP disk array. To register a P9000 disk array SVP IP address with the management station: 1. In the Register SVP IP/Save RWC Credentials section, select a P9000 disk array from the Array list.
NOTE: This change affects only those messages that are created after you instigated the severity change. All messages that were logged before you set the severity level still remain in the HP XP P9000 Performance Advisor database and appear on the Event Log screen. To set the severity level: 1. Click PA and DB Settings+User Settings in the left pane. The User Settings screen appears. 2. 3.
Complete the following steps to select the duration: 1. Click PA and DB Settings+User Settings in the left pane. The User Settings screen appears. 2. 3. In the Data Analysis Settings section, select the duration from the drop-down list. You can select a maximum of seven days. By default, HP XP P9000 Performance Advisor considers a duration of two days for the prediction. Click Save. HP XP P9000 Performance Advisor does the following: 1.
If the HP XP P9000 Performance Advisor Tomcat service is manually stopped, the HP XP P9000 Performance Advisor Monitor service does not take any action, which includes not sending any email notifications. The following messages appear in the jakarta_service_.log file located in the \pa\tomcat\logs folder if the HP XP P9000 Performance Advisor Tomcat service is manually stopped.
During the course of monitoring, if the HP XP P9000 Performance Advisor Monitor service identifies that the HP XP P9000 Performance Advisor Database and Database Listener services are manually stopped or have abruptly stopped or failed to start, it notifies the intended email recipients. However, it does not attempt to restart these services in case of failure. You will have to manually restart the services and contact HP Support for further assistance if the services do not restart.
The PAMonitor_mail.properties file is located in the :\HPSS\ paMonitor\conf folder on your management station. Configuring retry count IMPORTANT: Applicable only for HP XP P9000 Performance Advisor Tomcat service. Specify the number of times the HP XP P9000 Performance Advisor Monitor service must attempt to start the HP XP P9000 Performance Advisor Tomcat service in the PAMonitor.properties file located in the :\HPSS\paMonitor\conf folder on your management station.
If there is a configuration change in the above-mentioned LUN attributes, edit the custom groups to add the corresponding LDEV records again. It ensures that you view the updated data on the LDEVs and the associated LUN attributes. • If you group the LDEVs by host groups and then modify the name of the host group, delete and re-create the custom groups. Creating custom groups To create a custom group: 1. Click Customize Settings+Custom Groups in the left pane.
The selection in each filter is independent of the selection in other filters. Example, if Array_1 is selected from the Arrays: Array Names list, the Ports and ACPs lists are not updated to display only the ports and ACPs that belong to Array_1. They still display all the ports and the ACPs that belong to all the monitored XP and P9000 disk arrays. To filter and view specific set of LDEV records: 1. Select the values from the above-mentioned custom group filters and click Filter.
1. Click Customize Settings+Custom Groups in the left pane. The Custom Groups screen appears. 2. 84 Under List of Custom Groups, select the custom group you want to view.
3. Click View. The View button is enabled only when you select LDEV records in the Custom Groups table. The View Custom Group Details screen appears providing the list of LDEVs added to the selected custom group. The following table describes the column headings in the Group Details screen. Table 5 Group Details screen Screen elements Description DKC Displays the IDs of the selected XP and P9000 disk arrays.
Table 5 Group Details screen (continued) Screen elements Description Host Group Displays the host group name for the host. The host group name is a user-defined group on an XP or a P9000 disk array. ACP Pairs Displays the selected ACP pairs. RG Displays the selected RAID groups. Jnl Displays the identification numbers of the continuous access journal groups.
The records are removed and the list is refreshed. Click X on the View Custom Group Details screen title bar to close the window. Deleting custom groups To delete a custom group: 1. Click Customize Settings+Custom Groups in the left pane. The Custom Groups screen appears. 2. 3. Select a custom group from the list under List of Custom Groups. Click Delete. The Delete button is enabled only when you select a custom group under List of Custom Groups.
Screen elements Description Emulation Displays the emulation types. An array group is divided into open volumes of the same size. These volumes are called emulation types. SSID Displays the SSID. RG Displays the RAID group to which the host belongs. Jrnl Group Displays the identification number of the continuous access journal group. ACP Pair Displays the identification number for the ACP pair. Array Type Displays the type of the selected XP or P9000 disk array.
• Target: LUN list • Volume Group list • Device File list • RG list • LDEV list The selection in each of the above-mentioned filters is independent of the selection in the other filters. 3. Click Query. The existing list is filtered to display the set of fabricated LDEV records based on your selection.
NOTE: If you enter values in the text boxes (see step 4) and also in the Data Grid Update table text boxes, HP XP P9000 Performance Advisor considers the values entered in the text boxes displayed above the list of LDEV records. IMPORTANT: The following fields are checked against a specific criteria: • Target:LUN: Target >=0 and <=128, LUN >=0 and <=2048. • SSID: >=-1 and <=256. If a value -1 is displayed in any of the columns, you may want to edit the column and submit it to the database. 4.
4. 5. • Volume Group • Device File • SSID Clear the selection for the existing record and select the check boxes for those LDEV records that you want to apply the template for. Use the Shift key or Ctrl key for selecting multiple component records. Click Update Records. The values displayed in the above text boxes are replicated accordingly across the selected set of LDEV records.
Creating a user record To create a new user record: 1. Click PA and DB Settings+Security in the left pane. The Security screen appears. 2. 3. 4. Click New. Enter the following details for the user in the popup window that appears: • The name of the new user and a brief description about the user profile. • A password. • Confirm the password. • Assign the user to a group. The Select a Group list displays Administrators and StorageAdmins (read and write access), and Users (read access) privileges.
3. Click Delete. Click Yes in the popup window that appears, to permanently delete the user record. Click No to retain the user record. Related Topics • “Creating a user record” (page 92) • “Changing password” (page 92) • “Viewing group properties” (page 93) Viewing group properties To view the properties of a group: 1. Click PA and DB Settings+Security in the left pane. The Security screen appears. 2. 3. Select a user record from the list of records displayed under Groups. Click Properties.
6 Monitoring performance of XP and P9000 disk arrays This chapter discusses the following topics: • “Introduction” (page 94) • “Configuring dashboard threshold settings” (page 97) • “Viewing dashboard” (page 103) Introduction HP XP P9000 Performance Advisor provides a dashboard, where you can view the overall usage status of the XP and the P9000 disk arrays. The overall usage status is based on the usage of individual components.
For more information on the sections in the Dashboard screen, see “Viewing dashboard” (page 103). For more information on setting thresholds and specifying the X busiest components, see “Configuring dashboard threshold settings” (page 97) and “Specifying the top 20 consumers” (page 99). NOTE: ACP and DKA, CHIP and CHA are terms that are used synonymously across the HP XP P9000 Performance Advisor screens and in this user guide.
Figure 7 Dashboard screen 1 The Threshold Setting screen where you set the threshold levels. 2 The XP/P9000 Array Health section, where status icons are displayed that indicate the overall usage of the XP and the P9000 disk arrays in a particular category. 3 The Statistics section, where the average usage summary of individual components are displayed. You can plot their usage graphs in the Chart Work Area.
Configuring dashboard threshold settings IMPORTANT: • Since, the CHIP/CHA and the ACP/DKA MPs are moved to the MP blades in the P9000 disk arrays, the CHA Util (%) and the DKA Util (%) metrics are not applicable for the P9000 disk arrays. These metrics are only applicable for the XP disk arrays. • You must log in as the default Administrator or as a user with administrator privileges to configure the dashboard threshold settings.
2. Click the text box corresponding to a metric and category whose overall usage summary you want to view. For example, to view the overall usage status of an XP disk array in the Backend category, set the threshold limits for the backend metrics, such as the RG Util (%) and the DKA Util (%) metrics. 3. Enter the threshold value. When you set the threshold limits, HP XP P9000 Performance Advisor verifies the usage of components against the set threshold limits.
NOTE: 5. • By default, the duration is set to 6 hrs in the Threshold Setting screen. • All the charts in the dashboard screen is displayed for 1 hour if the duration selected is current in the Threshold Setting screen. • Ensure that both the host agents and the management station is in sync. • Ensure that the system clock time on both the host agents and management station is in sync. Click Save. For the selected threshold duration, HP XP P9000 Performance Advisor does the following: 1.
NOTE: screen. The LDEVs, journal groups, or the E-LUNs are referred as consumers on the Dashboard By default, the consumers are sorted in a descending order and displayed in the Component Information section. The consumers with quicker average read and write response time or a high average MP blade utilization are displayed first, followed by those with higher response time and low average utilization values.
Screen elements Description MBPS The MBPS threshold value indicates the average MB/s that you define an individual port can handle over a specified duration. HP XP P9000 Performance Advisor uses this value to verify whether the average MB/s value on each port is within or beyond the set threshold. If the average MB/s on a port exceeds the defined threshold limit, the CHA Util (%) status icon appears. The CHA Util (%) threshold value indicates the average overall MPs utilization on an installed CHA.
Screen elements Description whether the average sequential I/Os on each RAID group is within or beyond the set threshold limit. If the average sequential I/Os on a RAID group exceeds the defined threshold limit, the RG NonSeq Reads (IOPS) status icon appears. The RG nonseq frontend reads (IOPS) threshold value indicates the average non-sequential backend read tracks that you define an individual RAID group can manage over the threshold duration.
Screen elements Description NOTE: The MP Blade Util (%) metric is applicable for MP blades on the P9000 disk arrays. Viewing dashboard HP XP P9000 Performance Advisor displays the overall usage summary of the XP and the P9000 disk arrays on the Dashboard screen, which appear after you log on to HP XP P9000 Performance Advisor. If you are on another screen, click Monitoring in the left pane to view the Dashboard screen.
NOTE: • Click Add New Licenses to add licenses for the XP and the P9000 disk arrays on the License screen. For more information, see “Installing licenses” (page 30). • Click Edit Threshold to specify the threshold limits and threshold duration. • If you have modified the threshold limits for an XP or a P9000 disk array, manually refresh the Dashboard screen to view the updated dashboard status.
Status icon Description Indicates that the particular category is not applicable for the selected array. appears in the MP Blade category for the XP disk arrays, as the MP blade related metrics are applicable only for the P9000 disk arrays. Further, the status icon (Critical) takes precedence over the (Major) and (Normal) status icons.
HP XP P9000 Performance Advisor considers the following factors to arrive at the average usage data for a component in the Frontend, Cache, Backend, and the MP Blade categories: • Threshold limits set for metrics in the Frontend, Cache, Backend, or the MP Blade category • Threshold duration (6 hours, 12 hours, or 24 hours) After the threshold limits are defined for the categories and the corresponding metrics on the Threshold Setting screen, HP XP P9000 Performance Advisor does the following for the XP
Component levels in the Statistics section When you click a status icon in the Frontend, Cache, Backend, or the MP Blade category, the related component usage data appears in the Statistics section. Component levels Description Components with a red status icon beside them ( ) Indicates that the usage of a component corresponding to a particular metric has crossed the threshold limit during the specified threshold duration.
Category Metrics Description In addition, the Side File Usage (%) data and the Cache Size (total in MB) are also displayed.
Category Metrics Description NOTE: In a 100% ThP environment, the Dashboard Backend metrics show zero values for an XP or a P9000 disk array. This is because, the I/O per second data and the MB/second data throughput is on the V-Vols rather than the pool LDEVs in a RAID group. To view backend transfers on such RAID groups, refer to the corresponding combined backend transfer values.
Related Topics • “XP/P9000 array health” (page 104) • “Dashboard busiest consumers” (page 110) • “Dashboard charts” (page 111) • “High watermark in dashboard charts” (page 112) • “Plotting charts” (page 233) Dashboard busiest consumers You can view the maximum X busiest consumers associated with the selected frontend, cache, backend, or the MP blade components in the Component Information section.
Metrics Description Block IO MBPS The frontend throughput in MB/s read and written to the LDEV during the specified threshold duration. RG Util (%) The average of the overall RAID group utilization of an individual RAID group associated with the LDEV. Backend Transfer The I/Os between the cache and the RAID groups during the specified threshold duration. For a P9000 disk array, the average utilization of an individual MP blade by the associated consumer is displayed under the Util % column.
3. Select the check box for the metric, for which you want to view the performance or usage graph of the selected component, and click OK. HP XP P9000 Performance Advisor plots the appropriate graphs in the Chart Work Area. The duration for which the data points are plotted in the chart depends on the threshold duration specified on the Threshold Setting screen. By default, the graphs are plotted for data points collected in the last 6 hours of the management station's time.
IMPORTANT: • High watermark is applicable only for components in the Frontend, Cache, Backend, and MP Blade categories. It is not applicable for LDEVs. • High watermark is displayed for only one component and metric combination. It is disabled if you choose multiple components and metrics. 1 High watermark level.
7 Configuring alarms and managing events This chapter discusses the following topics: • “Introduction” (page 114) • “Configuring alarms and viewing alarms history” (page 114) • “Managing alarm history” (page 129) • “Viewing events” (page 135) Introduction HP XP P9000 Performance Advisor enables you to activate alarms on components, so that timely notifications can be dispatched to intended recipients when the performance of components rise beyond a particular limit.
Once the alarms are activated, you can view history for these alarms, which provides data on the following: • When the performance of components went beyond or dropped below the set threshold limits • Time stamps of alarm notifications dispatched to the intended recipients You can also view the corresponding performance graphs for components on which alarms are generated. The following are the high level sequence of steps you must perform to activate alarms and view history for configured alarms: 1.
NOTE: • If you configure alarms at the host group level, and then edit a host in any port, the alarm notification is sent only for the common host group that is configured. The notifications are not sent for the edited host group. To receive notifications for the edited host group, re-configure the alarms. • If you change the name of a host group that has alarms configured, delete and re-configure all alarms for that host group.
When you click Add alarm(s), the record pertaining to 53046 and the SM CHIP BUS/Path Util metric is added to the Alarms table. The Resource column displays All, which implies that the alarm is configured within the scope of the selected metric on all the components in 53046.
all the alarm records configured on the selected XP and P9000 disk arrays, and component are displayed in the Alarms table. Filtering records is based on the metrics and status of alarms configured on components and provides records specific to a selected metric and alarm status. To filter records: 1. Go to the Show section above the Alarms table. 2. You can filter alarm records based on: • Array: The Array list displays only those XP and P9000 disk arrays for which alarms are configured.
recipients when the current performance value of a component goes beyond the threshold level that you configured. NOTE: You can also use the Ctrl + c and Ctrl + v combination to copy and paste the threshold level from one record to another record. Ensure that the records are selected, so that the latest changes are updated. To set the threshold level: 1. Click PA and DB Settings+Configure Alarms in the left pane. 2.
in the subject line of the email. If the alarm is entering the dispatch at threshold level, HP XP P9000 Performance Advisor identifies the alarm as a normal alarm and populates the subject line of the email with P9000 Alarm. If the alarm is exiting the dispatch at threshold level, HP XP P9000 Performance Advisor identifies the alarm as a recovery alarm and populates the subject line of the email with P9000 Alarm - Good Information Alarm.
The changes are updated in the HP XP P9000 Performance Advisor database and accordingly reflected in the Email Destination box and the SNMP Destination box for the selected component records.
3. Provide the script location in the text box under Script Destination. HP XP P9000 Performance Advisor automatically executes the script when the performance of a component crosses the set threshold level. The output of the .bat file provided will be present in the absolute path location (example: C:\Users\Administrator folder or system 32 folder), as it is platform dependant. Therefore, ensure that you provide the absolute path while creating the .bat file.
2. In the Alarms table, select the component records for which you want to specify the threshold level. You can also filter component records in the Alarms table. • To enable alarms on components, select Enabled from the list under the Enabled column. By default, the current state for a newly added component record appears as Disabled in the Alarms table. Once the alarm record is enabled, it implies that the selected component will be monitored by HP XP P9000 Performance Advisor.
3. 4. Select the records for which the copied settings should be applied. (It is not mandatory that you click the check box for a component record to select it). Click Apply Settings. If required, modify the alarm settings copied to the Settings section and then apply the updated settings to other records in the Alarms table. The configuration settings of the previously selected record are applied to all the other newly selected records. 5. Click Save to commit the changes.
1. Click PA and DB Settings+Configure Alarms in the left pane. 2. 3. Select the record that you want to delete. Click Delete. The records are permanently removed from the Alarms table. Once Alarm is deleted, an entry is displayed in the EventLog screen but it is not displayed under AlarmHistroy screen.
2. 126 After all the host groups are traversed, the pool branch is traversed, followed by back-end, replication-volumes, LUSE branch, and the Drive-Types branches.
Searching for components 127
NOTE: • For the Raid Group, the Host Group branch is traversed first, followed by the Pool branch, Back-end, and finally the Drive Types branch. • You can search for External Raid Groups as well by selecting Raid Group from the component drop-down list and querying for a specific External Raid Group. • When searching for concatenated Raid groups, you should enter a part of Raid group name and not the entire name.
IMPORTANT: • The search results are specific to an XP or a P9000 disk array. You cannot search for components (LDEVS, RG, HG, POOL, PORT) physical LDEVs that are spread across multiple XP and P9000 disk arrays. • The search is not supported in custom group. • Search does not support multiple entries. You can search only for one component (Ldev or RG or HG or Pool or Port) at a time.
In every data collection cycle, HP XP P9000 Performance Advisor retrieves and compares the current performance value of a component with the set threshold value. The time when this value was retrieved and compared is shown under Time Updated. If the current performance value exceeds the set threshold value, HP XP P9000 Performance Advisor does the following: 1. Posts a new record and displays the time of posting under Time Posted 2.
Table 7 Viewing alarm History records (continued) Screen elements Description NOTE: The Resource is displayed as PVOL: LDEVID (serial number) and SVOL: LDEVID (serial number) for the Pair Status alarms. Value Displays the current performance value that is recorded for a component. Click the link to view graphical representation of the performance of a component. For more information, see “Viewing graph of metric value's performance” (page 134).
Filtering records in Alarms History table To filter alarm history records based on Alarm History filters: 1. Click Monitoring+Alarm History in the left pane. The Alarms History screen appears. 2. Filter and view component records based on the following options. For description on each of the filters, see “Alarm History filters” (page 132): • Metric list: Displays the metrics for which components are selected and alarms configured on them.
Screen elements Description XP P9000 Performance Advisor displays only zero items, that is the alarms that were successfully dispatched. Arrays list Displays the disk arrays for which alarms are generated. Time Stamp list This list displays the following options: • Time posted (default selection): If this option is selected, the time stamps of when the records are posted on the Alarm History screen are displayed.
Related Topics • “Understanding alarms history” (page 129) • “Alarm History screen” (page 130) • “Filtering records in Alarms History table” (page 132) • “Viewing graph of metric value's performance” (page 134) • “Adding or removing metric values” (page 116) • “Configuring notification and monitoring settings” (page 117) Viewing performance graphs for components HP XP P9000 Performance Advisor logs a new record in the Alarms History table when either of the following conditions are met: • The p
The performance graph also displays the Dispatch Threshold value that is the threshold value for which an alarm was configured to be dispatched. The Dispatch Threshold value is displayed for only one component and metric combination. It is disabled if you choose multiple components and metrics. The Dispatch Threshold value acts like a watermark and helps you to identify the maximum threshold limit that was set and the current performance value of the component.
In addition, view the following details on the Event Log screen: • Historic data (data older than 24 hours) by specifying a date range for viewing the data. • Filter the event records based on severity and type of events generated. Click a column heading to sort the records based on that column. By default, columns are sorted in ascending order. Click the column heading again to reverse the sort order.
4. Select one of the following severity level from the Severity list. By default, the event records for all levels of severity are displayed: Severity level Description User Action Errors for user-instigated activities, like if the user deletes a performance data collection schedule. System Error Exception errors given by HP XP P9000 Performance Advisor. Critical Error Critical errors, where HP XP P9000 Performance Advisor may not function.
8 Managing the HP XP P9000 Performance Advisor database This chapter discusses the following topics: • “Introduction” (page 138) • “Configuring database size” (page 140) • “Purging data” (page 142) • “Creating and viewing Export DB CSV files” (page 146) • “Archiving data” (page 157) • “Importing data” (page 160) • “Deleting logs for archival and import activities” (page 162) Introduction HP XP P9000 Performance Advisor uses Oracle as its database.
IMPORTANT: • You have to log on to HP XP P9000 Performance Advisor as an Administrator or a user with administrator privileges to configure, purge, archive, or import the HP XP P9000 Performance Advisor database. You also need this privilege to view or delete Export DB schedules. • Database related tools or functionalities should be executed with the same privilege that is used to install HP XP P9000 Performance Advisor.
• “Importing data” (page 160) • “Deleting logs for archival and import activities” (page 162) Configuring database size You can increase the HP XP P9000 Performance Advisor database size based on the disk space available on the management station, where HP XP P9000 Performance Advisor is installed. It can be a manual or automated process, where HP XP P9000 Performance Advisor checks the available disk space and increases the database size appropriately.
the Event log screen:There is not enough space for the DB to autogrow; AutoGrow option is disabled. If free disk space is not available, HP XP P9000 Performance Advisor logs the following message:There is not enough space for PADB. PADB requires minimum . The Auto Grow check box is automatically disabled. HP XP P9000 Performance Advisor verifies the disk space and logs the above-mentioned message on the Event Log screen every minute till the required disk space is made available.
1. Click PA and DB Settings+Database Manager in the left pane. The Database Manager screen appears. By default, the DB Configuration/Purge is enabled. 2. From the Configured Maximum Database Size list, select the disk space that you want to allocate. By default, the Current Database Size displays 3 GB that is the default disk space allocated for HP XP P9000 Performance Advisor database after first installation.
Manually purging data You can manually purge data that belongs to an XP or a P9000 disk array, or data that is older than the current specified date. CAUTION: The data that is purged cannot be recovered. It is permanently deleted from the HP XP P9000 Performance Advisor database. Hence, purge data only when you are absolutely sure that the data is no longer required.
Related Topics • “Automatically increasing the database size (AutoGrow)” (page 140) • “Manually increasing the database size” (page 141) • “Automatically purging data” (page 144) • “Creating and viewing Export DB CSV files” (page 146) • “Archiving data” (page 157) • “Importing data” (page 160) • “Deleting logs for archival and import activities” (page 162) • “Migrating data to another management station” (page 163) Automatically purging data HP XP P9000 Performance Advisor automatically purg
If you enter an invalid value, then by default, the maximum threshold value is considered as 85. When the current database size reaches the default maximum threshold value of 85% of the allocated disk space, the Delete and Shrink operations are triggered immediately. • Scheduled_Time_For_Delete_Operation—The time set in this parameter is considered for triggering the Delete operation when the current database size exceeds the minimum threshold value.
IMPORTANT: • HP recommends that you schedule the Delete and Shrink operations at a different time in such a way that the Delete operation is performed first. • Auto purging defragments the allocated database space, so that the free space is released back to the database. • During the Shrink operation, the free disk space is not released back to the management station. It is released back to the database.
Related Topics • “Creating Export DB CSV files” (page 150) • “Viewing Export DB CSV files” (page 155) Export DB CSV files This section describes the following .csv files you can view when you save or schedule an Export DB report: ldev_exportDB-array_serial_number_.csv This file includes the following details: • The XP or the P9000 disk array serial number for which the report is generated. • The LDEVs present during the specified duration. • The RAID groups to which the LDEVs belong.
• The percentage of writes that are held in the cache, yet to be transferred to the disks over an entire collection interval. • The MB/s of the continuous access asynchronous sidefile usage over an entire collection interval. • The data accessed or the reads on a single CLPR over an entire collection interval. • The utilization of the shared memory CHIP/CHA and ACP/DKA transfer bus, and the utilization of the cache memory CHIP/CHA and ACP/DKA transfer bus.
This file includes the following details: • The P9000 disk array serial number for which the report is generated. • The MP blade IDs, the cluster # and the blade locations for the MP blades. • The average percentage of utilization over the entire collection interval. It is calculated as the utilization of all the individual processors in the MP blade. • The performance data collection interval time stamps.
Creating Export DB CSV files IMPORTANT: • If you have logged in with user privileges, you cannot schedule the export DB activity. • 020000 is the supported version for the P9000 disk arrays, such as the P9500 and the following XP disk arrays, XP24000, XP20000, XP12000, XP10000, and the SVN Disk Arrays. • 020000 is also the supported version if you want to view the external LUN information. • • 016000 or 020000 are the supported versions to view the response time values in the .csv files.
3. Based on your requirement, select the Collection Period as One Time or Recurring. • If you select the Collection Period as One Time, proceed to step 4.
◦ Collection Schedule: Displays Daily, Weekly, and Monthly. Collection Schedule Description Weekly By default, Weekly is selected as the collection schedule. The corresponding Day of the Week list displays the week days. If you want to configure a weekly schedule: – Select the week day when you want the schedule to be executed. – Select the time (hour : mins) when you want the schedule to be executed, from the Start Time lists. – Specify the number of times the schedule should repeat, in the No.
4. 5. 6. 7. Provide a name in the File Name box. The name must have a minimum of two characters and can have a maximum of 80 characters. HP XP P9000 Performance Advisor appends the name that you provide to the file names of all the .csv files that it generates. From the Array list, select the XP or the P9000 disk array for which you want to save or schedule the Export DB report. Select the check box for Human Readable Format, if you want to view the data for LDEVs in the cu:ldev format.
10. Select the check box for Display LDEV's of the Journal, if you want to view all the LDEVs that belong to a journal pool. 11. Select the Start Time and End Time, if it is a one-time export activity. If you are scheduling the export activity, select only the start time. 12. If you are scheduling the export activity, retain the recipient email address displayed in the Email box or specify an email address where you want to receive the notifications. If you are saving the export DB report, the .
• “Importing data” (page 160) • “Deleting logs for archival and import activities” (page 162) • “Migrating data to another management station” (page 163) • “Generating, saving, or scheduling reports” (page 297) Importing data to MS Excel To import data into an Excel sheet: 1. Open the export DB file in MS Excel from the location where it is saved (\HPSS\pa\tomcat\ webapps\pa\reports). The Text Import wizard appears. 2. 3. 4. 5. 6. 7.
IMPORTANT: • The name of the user who created the report is displayed under User Name. If you logged in to HP XP P9000 Performance Advisor as an Administrator and created the Export DB report, the user name is displayed as Administrator. • The .csv records for which an asterisk (*) is displayed before the User Name indicates that they are generated through a schedule. The naming convention for the .
• “Migrating data to another management station” (page 163) • “Generating, saving, or scheduling reports” (page 297) Deleting Export DB reports and schedules IMPORTANT: You can delete a schedule record in the Scheduled Export DB tasks section, only if you have logged in to HP XP P9000 Performance Advisor as an Administrator or a user with administrator privileges. To delete an Export DB report or the corresponding schedule: 1. Click PA and DB Settings+Database Manager. 2.
IMPORTANT: • After the data is archived, it is permanently deleted from the HP XP P9000 Performance Advisor database and the free disk space is released back to the database. If you want to use the archived data for an XP or a P9000 disk array, import the corresponding .dmp files. Also, perform a fresh configuration data collection for that XP or the P9000 disk array on the management station, where you performed the import operation.
5. Click Export. HP XP P9000 Performance Advisor archives data for the specified duration. As part of the archival process, HP XP P9000 Performance Advisor does the following: a. Displays an informational message that the export for the selected array is successfully initiated and starts exporting the data. b. Logs two records under Export data for the date and time when the archival is complete. c. Creates two .dmp files and displays their names under File Name.
Importing data You can import the archived data to another management station or back to the same management station from where the data was initially exported. CAUTION: • You must import the data to the same version of the management station as that of the installed HP XP P9000 Performance Advisor. For example: If you have installed HP XP P9000 Performance Advisor v5.3, then you must import the data to management station version 5.3.
IMPORTANT: • The following are a few important points: After importing performance data for an XP or a P9000 disk array, ensure that you perform a fresh configuration data collection for that XP or the P9000 disk array on the target management station, as the archival process only exports the performance data.
NOTE: 4. translates to %PADB_HOME% in this context of importing data. Click Import. Based on whether the import is for an XP or a P9000 disk array, HP XP P9000 Performance Advisor does the following: a. Displays an informational message that the import for the selected XP or the P9000 disk array is successfully initiated. b. Imports performance data from the .
2. 3. 4. 5. On the Database Manager screen, click the Archive Export/Archive Import tab. Based on whether you want to delete the archival logs or the import logs, navigate to the Archive Data section or the Archive Import section. Select the export or import logs that you want to delete. Click Delete.
P9000 disk arrays during the specified duration is backed up into the following .dmp files: • PA_Exp.dmp up to PA_Exp5.dmp • xpslperf_Data1.dmp up to xpslperf_Data5.dmp xpslperfConfigData6.dmp, which contains the configuration data The .dmp files are generated only for those components that are configured on the XP or the P9000 disk arrays.
2. 3. Based on your requirement, select one of the following options: • DKC: Provide the 5 digit serial number of the XP or the P9000 disk array, for which you want to take the data backup • Time: Provide the duration for which you want to take data backup in the DD-MM-YYYY format. • All: Clicking this option will initiate a backup of the complete HP XP P9000 Performance Advisor database Click Backup. The Backup option is enabled only when you select one of the above-mentioned backup options.
Where, target-path is the location, such as a network drive or shared file system where you want to save the backup files. You can also backup data for an XP or a P9000 disk array DKC or a particular duration.
/ Port_Collection_ frequency) * PORTs * Port_Space] + [(SECONDS_PER_DAY/ Dkc_Collection_ frequency) * Dkc_Space] where: • Free_Space (MB/day) = Total free disk space (in MB) required for a day • LDEVs = Total number of LDEVs in an XP or a P9000 disk array (includes journal volumes, pool volumes, external volumes, and so on) • PORTs = Total number of ports for an XP or a P9000 disk array • Ldev_Collection_frequency = Collection frequency for LDEVs (in seconds) • Port_Collection_frequency = Collectio
Example 1 Determining the disk space requirements for HP XP P9000 Performance Advisor Consider that the P9000 and the XP disk arrays, P9500 and XP24000 are monitored by the HP XP P9000 Performance Advisor management station. • P9500 Disk Array details: ◦ LDEVs = 1703 ◦ PORTs = 96 ◦ Dkc_Collection_frequency = 300 seconds (5 * 60) ◦ Ldev_Collection_frequency = 600 seconds (10 * 60) ◦ Port_Collection_frequency = 600 seconds (10 * 60) Free_Space on P9500 Disk Array = [(86400/600) *1703 * 0 .
9 Viewing XP and P9000 disk array components This chapter discusses the following topics: • “Introduction” (page 169) • “Viewing performance summary” (page 174) • “Viewing XP and P9000 disk array summary” (page 178) • “Volume Information” (page 179) • “Advisory on CLPR utilization” (page 182) • “Viewing CHIP/CHA data” (page 182) • “Viewing ACP/DKA data” (page 186) • “Viewing MP blade utilization for P9000 disk arrays” (page 190) • “Viewing Smart and ThP pools data for P9000 disk arrays” (pa
1. Click Monitoring+Array View in the left pane. All the XP and the P9000 disk arrays monitored by HP XP P9000 Performance Advisor are grouped under Arrays. Custom groups, if configured are grouped under Custom Groups. 2. To view the performance, summary, and utilization of an XP or P9000 disk array, click the plus (+) sign for Arrays and select the disk array in the component selection tree.
Figure 11 Array View screen Further, to view the performance and utilization metrics at the component level in the disk array, click the plus (+) sign for the disk array and select the component node from the list displayed. Click each component under a particular component node to view the individual performance or utilization data. For example, clicking CHA/DKA for a P9000 disk array displays the performance summary of all its CHA ports and the DKAs.
Table 8 Array View component nodes (continued) Component selection tree Description Documentation Links For XP disk arrays For P9000 disk arrays “Viewing LDEV data” (page 213) Yes Yes FrontendIO Provides the list of “10 busiest Yes busiest frontend LDEVs LDEVs/Ports” (page 205) and the ports associated with the LDEVs Yes BackendIO Provides the list of “10 busiest LDEVs/RAID Yes busiest backend LDEVs groups” (page 206) and the ports associated with the LDEVs Yes RG Summary Provides the followin
Table 8 Array View component nodes (continued) Component selection tree Description Documentation Links For XP disk arrays For P9000 disk arrays Port Summary “Port summary” (page 210) Yes Yes Provides the following “Viewing MP blade No details for an MP blade: utilization for P9000 • Average utilization of disk arrays” (page 190) Yes Provides the following details for a port: • Performance summary for all the related metrics • Current configuration, which includes the component type and the associ
Table 8 Array View component nodes (continued) Component selection tree Description Documentation Links CHA/DKA • “Viewing CHIP/CHA No data” (page 182) Provides the following details for the installed CHA and the DKA: • Average performance derived from the overall average performance of all the ports in the CHIP or the RAID groups in the DKA For XP disk arrays For P9000 disk arrays Yes • “Viewing ACP/DKA data” (page 186) • Average performance of individual ports for a CHA • Average performance of in
The following table describes the Performance View screen elements. The images shown are for 53036, which belongs to the P9500 Disk Array type.
Performance View screen elements Description CHIP Port Activity Ave group box Displays the I/Os, MB/s, and the associated port IDs for all those CHIPs/CHAs that are processing requests. The port type, such as Fibre or FCoE (applicable only for P9000 disk arrays) is also displayed beside the port ID. For a P9000 disk array, the CHAs are grouped based on the clusters to which they belong. For more information, see “Viewing CHIP/CHA data” (page 182).
Performance View screen elements Description by only DKA_1. If the combined backend transfers on ThP_Pool_1 is 50 I/Os, and ThP_Pool_2 is 30 I/Os, the combined backend transfers of DKA_1 is 80 I/Os (sum of the backend transfers on ThP_Pool_1 and ThP_Pool_2), and DKA_2 is 50 I/Os (sum of the backend transfers on ThP_Pool_1). MP Blades Util % group box Displays the average utilization of an MP blade, which is calculated as the utilization of all the individual processors in the MP blade.
IMPORTANT: • The MIX CHIP displays only eight ports and four MPs though there are eight MPs on that board. The remaining four behave as ACP MPs. • If performance data is collected separately for the DKC, ports, and the RAID groups, through two different schedules, all the metrics display the latest data as received by the management station, from either of the schedules. For more information about schedules, see “Data Collection Configuration” (page 43).
IMPORTANT: The RmLib Version displays zero if the configuration data is collected through the outband mode. Volume Information The following table provides a summary of all the components for the selected XP or the P9000 disk array. Physical LDEVs The total number of LDEVs created from RAID groups. Ports The total number of Ports available from the installed CHAs. LUNs The number of LDEVs that have one or more associated paths (host connectivity).
• “10 busiest LDEVs/Ports” (page 205) • “10 busiest LDEVs/RAID groups” (page 206) • “RAID Group summary” (page 208) • “Port summary” (page 210) • “Viewing LDEV data” (page 213) Viewing utilization summary The utilization summary is displayed for the selected XP or the P9000 disk array when you click the Utilization Summary tab. The following image shows the utilization summary for 53036, which belongs to the P9500 Disk Array type.
• MP blade utilization, which includes the following: ◦ MP blade IDs. ◦ DKCs, cluster #, and the blade locations for the MP blades. ◦ The MPs on the MP blade and each MP's utilization percentage. Click an MP to view the corresponding utilization percentage graph in the Chart Work Area. By default, the data displayed is for the last one hour. • CHIP data, which includes the following: ◦ DKCs, cluster #, and the slots where the CHAs are located.
Advisory on CLPR utilization HP XP P9000 Performance Advisor provides an advisory on the usage of individual CLPRs in an XP or a P9000 disk array. The advisory is based on the data collected for the past one week. The following are the scenarios for which an advisory is created: • If the cache for a CLPR is less utilized, the advisory suggests that you consider re-allocating portion of the cache to the other CLPRs.
The summary is displayed in the CHIP/CHA summary table for the XP disk arrays and the CHA summary table for the P9000 disk arrays (see following images). • The CHIP/CHA summary table includes the performance and utilization metrics of all the installed CHIPs/CHAs • The CHA summary table includes only the performance metrics of all the installed CHAs Further, you can also click an individual CHIP/CHA in one of the above-mentioned tables to view its metrics.
The following table describes the CHIP/CHA summary table for an XP disk array and the CHA summary table for a P9000 disk array. CHIP/CHA summary table for XP disk arrays includes... CHA summary table for P9000 disk arrays includes... The CHIP or the CHA name The CHA name Example: CHA-1EU Example: CHA-1F, 1 indicates the cluster # where the CHA board is located.
IMPORTANT: • The port type, such as Fibre or FCoE (applicable only for P9000 disk arrays) is also displayed beside the port ID. • Since, the CHIP/CHA and the ACP/DKA MPs are moved to the MP blades in the P9000 disk arrays, their MP utilization metrics are not applicable for the P9000 disk arrays. For more information, see “Viewing MP blade utilization for P9000 disk arrays” (page 190).
The individual performance data for CHA-1EU includes the following: • • Summary: ◦ Fibre protocol is used ◦ Eight ports are associated with CHA-1EU ◦ Port Activity Avg shows average I/Os as 10409.17, which is an average of the overall average I/Os on all the eight ports. It also displays the average MB/s as 81.33, which is the an average of the overall average MB/s on all the eight ports.
Further, you can also click an individual ACP/DKA pair in one of the above-mentioned tables to view its metrics. For more information, see “Viewing summary of an individual CHIP/CHA” (page 185).
The following table describes the ACP/DKA summary table for an XP disk array and the DKA summary table for a P9000 disk array. ACP/DKA summary table for XP disk arrays includes... DKA summary table for P9000 disk arrays includes... The ACP/DKA pair name The DKA pair name Example: BUNU Example: AUMU The individual MPs on an ACP/DKA and the utilization percentage of each MP Not applicable In the above image, BU MP Utilization % indicates the utilization of the MPs on BU, which is the left ACP.
In addition, the combined backend transfer value is displayed for each ACP or DKA (applicable only for XP24000 and P9000 disk arrays). For more information, see the description provided for ACP Pair Backend group box in “Viewing performance summary” (page 174). IMPORTANT: Since, the ACP/DKA MPs are moved to the MP blades in the P9000 disk arrays, their MP utilization metrics are not applicable for the P9000 disk arrays.
Related Topics • “Viewing performance summary” (page 174) • “Viewing ACP/DKA data” (page 186) • “Viewing MP blade utilization for P9000 disk arrays” (page 190) • “Viewing Smart and ThP pools data for P9000 disk arrays” (page 194) • “Utilization Summary” (page 180) • “10 busiest LDEVs/Ports” (page 205) • “10 busiest LDEVs/RAID groups” (page 206) • “Port summary” (page 210) • “Viewing LDEV data” (page 213) Viewing MP blade utilization for P9000 disk arrays Click an MP blade ID in the MP Blad
On the following MP Blades screen, you must click an MP blade ID in the MP Blade Configuration group box (see “MP Blades screen” (page 191)) to view the above-mentioned list. In the following image, the MP Blade Summary , Processing Distribution , and the Top Components are displayed for MPB-1MA. For more information, see “MP blade utilization summary” (page 191).
Table 9 MP blade utilization summary (continued) MP blade screen elements Description 25% of the CPU cycles are utilized for processing the array backend activities. • No. of LDEVs, No. of Ext. Vols, No. of Cont. Access Jnl Groups: The number of consumers for the MP blade, which can be LDEVs, external volumes, and the continuous access journal groups. The total of the above-mentioned constitutes the total number of consumers for the selected MP blade.
The MPB-1MB utilization data includes the following: • MPB-1MB is the MP blade ID that was selected in the MP Blades Util% group box. MPB-1MB is also listed in the MP Blade Configuration group box. • MPB-1MB belongs to the Cluster 1 and the DKC 0. • 1 in MPB-1MB represents the cluster # and MA represents the blade location for MPB-1MB. • MP 0, MP 1, MP 2, and MP 3 are the MPs on MPB-1MB. • The average utilization of MPB-1MB is 2%.
Related Topics • “Viewing performance summary” (page 174) • “Viewing ACP/DKA data” (page 186) • “Viewing Smart and ThP pools data for P9000 disk arrays” (page 194) • “Utilization Summary” (page 180) • “10 busiest LDEVs/Ports” (page 205) • “10 busiest LDEVs/RAID groups” (page 206) • “Port summary” (page 210) • “Viewing LDEV data” (page 213) Viewing Smart and ThP pools data for P9000 disk arrays HP XP P9000 Performance Advisor provides the current configuration and performance data for the Sma
Figure 15 THP Pool Screen IMPORTANT: The data on the Smart pools and the ThP pools are not displayed if the pools are not configured in the selected P9000 disk array. The following error message is displayed: Smart and ThP pools are not configured for this P9500 Disk Array.
Table 11 Smart Pool monitoring information table Label name Description Last available start time Displays last available monitoring cycle start time with PADB. Last available end time Displays last available monitoring cycle end time with PADB. Relocation Type Displays type of tier relocation. For example, Auto or Manual. Monitoring Mode Displays mode of monitoring. For example, Period or Continuous. Monitoring Status Displays status of a monitoring cycle. For example, Monitoring or Stop.
Table 12 Pool Information table (continued) Column names Description Backend Tracks Displays the total backend tracks associated with the Smart pool or the ThP pool. It is an aggregate of all the backend transfers due to I/Os occurring on every VVol in the Smart pool or the ThP pool. Max Read Response Time Displays the maximum of Max Read Response time of the Pool Virtual Volumes. Max Write Response Time Displays the maximum of Max Write Response time of the Pool Virtual Volumes.
Table 13 Pool Details table (continued) Column names Description RG Level Displays RG level of a particular raid group. For External raid group this column is blank. Disk Type Displays disk type of a particular raid group. For External raid group this column is blank. Pool LDEVs Displays the individual pool volumes from the RAID group that are included in the Smart pool or the ThP pool.
Column names Description Used Capacity Displays the amount of tier space that is already utilized. Capacity Threshold Displays the maximum storage that is accepted on a particular tier level. You must have set this capacity threshold value on the P9000 disk array. % of Tier Configured Displays the percentage of space allocated for each tier from the total pool capacity to create a pool. Max IOPH Processed by the Tier Displays the maximum IOPH value that a tier can process.
Figure 16 Continuous Access Journal Figure 17 Continuous Access Sync Figure 18 Continuous Access Async Table 14 (page 201) describes the data displayed: 200 Viewing XP and P9000 disk array components
Table 14 Continuous access configuration data Screen element Description Primary Array Serial number of the primary XP or P9000 disk array (primary data center). PVOL LDEV configured as P-VOL on the primary data center. Displays the LDEV number in cu:ldev format. Secondary Array Serial number of the secondary XP or P9000 disk array. SVOL LDEV configured as S-VOL on the secondary data center. Displays the LDEV number in cu:ldev format.
Table 14 Continuous access configuration data (continued) Screen element Description Fence Level Fence level of target device (Pair volume). Displays one of the following: • ASYNC for asynchronous communications • DATA, STATE, or NEVER for synchronous communications • JNL for continuous access journal based transactions JNL-ID Journal ID of the journal group associated with the P-VOL or S-VOL.
Table 15 CA volume performance data and journal information (continued) Screen elements Description Avg Write MBPS Average MB of data written per second to the LDEV based on the selected CTG ID. Write MBPS Total MB of data written per second to the LDEV based on the selected CTG ID. Table 16 CA volume performance data Screen elements Description CA-VOL LDEV configured as the PVOL or SVOL LDEV on the array for which user is viewing the data. IOPS The total I/Os on the LDEV per second.
Table 17 CA port performance data (continued) Screen elements Description Avg IO Average I/O rate. Avg MB Average throughput. Table 18 (page 204) describes the performance metrics of journal group associated with the P-VOL belonging to the selected CTG: Table 18 CA journal Screen element Description Mirror Unit Number It identifies a pair relationship between journals. When a pair is created, it is assigned a mirror unit number. Consistency Group ID CTG to which the P-VOL belongs.
Table 19 (page 205) describes the performance metrics of LDEVs configured as journal volumes and associated with the P-VOL: Table 19 CA journal volumes Column Head Column Head LDEV ID LDEV configured as a journal volume. Displays the LDEV number in cu:ldev format. RG RAID group to which the journal LDEVs belong. MP Blade MP blade ID processing requests for the journal group. MP Utilization % Average utilization of the MP blades that are associated with the LDEVs.
IMPORTANT: • The response time is calculated from the time the I/Os are received by the CHA port till the time they are dispatched from the CHA port. • If the LDEV is a LUSE Master, the details of individual LDEVs are considered for the busiest components and not the sum of all the individual LDEVs. • The Maximum Port IO is the maximum of the last collection time stamp.
groups are displayed under the RG (RAID Group) tab. This data is also displayed when you click the Backend Total Avg group box under the Performance View tab. If the number of busiest LDEVs or RAID groups are less than ten or if their utilization is zero, only the busiest components are displayed. The 10 busiest LDEVs selected is based on the backend transfer rate and the 10 busiest RAID groups selected is based on the Overall % RAID Group Utilization.
Related Topics • “Viewing performance summary” (page 174) • “Viewing CHIP/CHA data” (page 182) • “Viewing ACP/DKA data” (page 186) • “Utilization Summary” (page 180) • “10 busiest LDEVs/Ports” (page 205) • “RAID Group summary” (page 208) • “Port summary” (page 210) • “Viewing LDEV data” (page 213) Viewing RAID group summary To view the summary of overall utilization of RAID groups for an XP or a P9000 disk array, click RG Summary in the component selection tree for that XP or P9000 disk arra
Figure 23 RAID Group summary Screen elements Description RG The RAID group to which the LDEV belongs. SLPR The SLPR with which the RAID group is associated. NOTE: SLPR does not exist in the P9000 disk arrays. So, the SLPR-related data is displayed only for the XP disk arrays. SLPR Name The SLPR group ID. NOTE: SLPR does not exist in the P9000 disk arrays. So, the SLPR group ID is displayed only for the XP disk arrays. CLPR The CLPR with which the RAID group is associated.
Screen elements Description will be reported as an aggregate value for all the RAID groups. % RGUtil Rand Read The random read utilization percentage for a RAID group. % RGUtil Rand Write The random write utilization percentage for a RAID group. % RGUtil Random Write Parity % RGUtil Random Write Parity The random write parity utilization percentage for a RAID group. % RGUtil Seq Read The sequential read utilization percentage for a RAID group.
Figure 24 Port summary Screen elements Description CHP Port ID Displays the port ID for the CHP port. Provides the option to view information associated with a particular port or with all ports. SLPR Displays the SLPR with which the RAID group is associated. NOTE: SLPR does not exist in the P9000 disk arrays. So, the SLPR-related data is displayed only for the XP disk arrays. SLPR Name Displays the SLPR group ID. NOTE: SLPR does not exist in the P9000 disk arrays.
effective way to exclude the impact of these transient spikes in the calculation of the bandwidth requirements. In HP XP P9000 Performance Advisor, view the percentile values for the average MB/s on continuous access ports and further estimate the required bandwidth for the continuous access link.
Viewing LDEV data HP XP P9000 Performance Advisor displays the following data on the Array View LDEV screen for all the LDEVs that belong to an XP or a P9000 disk array: • The performance data of all the LDEVs • The data on associated components, such as the following: ◦ ◦ The summary for individual RAID groups, which includes: – RAID level – Associated ACP pair – Disk mech details – Associated drive type and RPM rate The I/Os and MB/s data for individual CHIP ports For an XP disk array, in a
By default, the values displayed for the following are based on the performance values of all the LDEVs that are displayed for the last collection time stamp: • Total IOs: The total frontend I/Os handled by the selected XP or P9000 disk array. • Total MBs: The total frontend throughput in MB/s managed by the selected XP or P9000 disk array. • Total Tracks: The total tracks on the selected XP or P9000 disk array.
NOTE: The data for the following metrics sorts in the ascending order: • Host Group • Chip Port ID • ACP Pair ID • LDEV ID • Emulation • Cont. Access. The remaining metrics sorts in the descending order. “Array View LDEV table - Sort By options” (page 215) describes the sorting options based on which you can sort the data in the LDEV table.
Table 20 Array View LDEV table - Sort By options (continued) Screen elements Description • Sequential reads • Sequential writes LUSE Select LUSE to sort LDEV data based on the LUSE information, which indicates if an LDEV is also an LUSE (LUN Size Expansion (Luse).E = Master C = Component). LDEV ID Select LDEV ID to sort LDEV data based on their cu:ldev IDs. RG(s) Select RAID Groups to sort LDEV data based on the associated RAID groups.
3. Sort the LDEV data based on one of the options displayed in the Sort By list. By default, the LDEV data is sorted based on the average read response and displayed in a descending order in the LDEV table. For more information on the attributes, see “Array View LDEV table - Sort By options” (page 215). Before clicking the Query button, you can also select the attribute from the Sort By list. The LDEV data is automatically sorted based on the selected attribute and displayed in the LDEV table.
2. Select the check box for the component that must be monitored. Choose the Select All check box, if you want to choose all components and add them as columns of information to the LDEV table. 3. Click Update Columns. Clear the Column Settings check box to close the LDEV Column Settings list. Accordingly, new columns are added and the data for the selected components is displayed under the respective new columns in the LDEV table.
Table 21 Components and metrics in LDEV Column Settings list (continued) Screen elements Description NOTE: If an array is connected to a host agent that is running on HP-UX 11i v3 operating system, the DSF is displayed in a new format. A legacy DSF is displayed in parenthesis next to the new format. Backend Transfer Sequential Reads The backend transfer sequential reads for the LDEV. Backend Transfer Non-Sequential Reads The backend transfer non-sequential reads for the LDEV.
Table 21 Components and metrics in LDEV Column Settings list (continued) Screen elements Description The Luse master LDEV also lists an entry for the contributor. If you are filtering by Host, you cannot see the contributors, because they are not mapped externally. If you show Requested Hosts connected to the array, you can see the contributors in addition to the Luse master. Luse Master The LDEV ID of the Luse master when the LDEV is a component. If the LDEV is not a Luse component, this field is blank.
Table 21 Components and metrics in LDEV Column Settings list (continued) Screen elements Description Advisor reports volume groups from LVM (an HP brand) and VXVM (a Veritas brand). NOTE: • The E-LDEV, Ext-LUN, E-Port(s), E-Seq, Jnl Group, and Vol. Group are available for selection only if they are configured in the selected XP or P9000 disk array. • The following metrics are not applicable for the XP or the P9000 continuous access journal pool LDEVs.
The following are the different replication pair statuses: Replication pair statuses Description SMPLex Volume is not configured for replication activity. COPY Volume is in the Copy mode, where data from the P-Vol is being copied to the S-Vol. PAIRED Volumes are configured for replication activity. Pair Suspend The replication pair volumes are suspended mode. Pair Suspend Error The replication pair volumes are suspended, as an error is noticed with the pair.
Filter records based on existing selection This type of filter is applicable when you want to view the LDEV data based on your selection from an existing filter criteria. Following is an example on filtering records in the RAID Group list: 1. Click the RG list. 2. 3. In the RAID Group filter that appears, select the check box for those RAID groups, for which you want to view the corresponding LDEV data. Click OK. The LDEV table displays only those records that match the specified RAID group IDs.
Exporting LDEV data You can export LDEV data to an Excel spreadsheet for the date and time range that you specify. The data for all the LDEVs monitored by HP XP P9000 Performance Advisor during the specified start and end date, and time are exported to a spreadsheet in a CSV format. To export the LDEV data: 1. Select the date range from the Start Date and End Date calendars. 2. Select the time range from the respective hour : minutes : seconds lists. 3. Click Export to Excel.
is configured as 7D+1P. The system supports RMLIB version 1.16.04 and later. If there is an LDEV that is associated with two RAID groups, data about both the RAID groups are displayed. If LDEVs are associated with multiple RAID groups (such as in 4D+4D configurations where the LDEV is mirrored on two different RAID groups), these multiple RAID groups are treated as separate sets of items. For example, if you have an LDEV with RAID group 1-1 1-2, you must select 1-1 1-2 in the drop-down menu.
If there are no associated continuous access journal groups configured, – is displayed in the Jrnl Grp column. Viewing ThP Pool Occupancy information The ThP volumes that belong to a ThP Pool are displayed as THP-PID()and snapshot volumes that belong to a snapshot pool are represented as Snap-PID(), under RAIDGroup in the LDEV table. Click a THP-PID() to view the ThP pool occupancy information, which includes the mapping between the pool volumes (real LDEVs) and the V-VOLs.
IMPORTANT: • The LDEV table does not display hyperlinks in the ACP Pair ID and ACP Pair Util fields for RAID groups spanning across multiple ACP pairs. Hence, no chart for the same can be created. • For a P9000 disk array, the LDEV table does not display the ACP Pair Util field for RAID groups. So, a chart for the ACP pair utilization metrics cannot be plotted. • An XP24000 type array has 32 CHIPs, 8 ACP pairs, and 4 MPs per port, an XP20000 type array has 8 CHIPs, 4 ACPs and 4 MPs per port.
Additionally, the CLPR table displays the following details: • RAID group • LDEV IO/s • LDEV MB/s • Backend transfer data • Overall RAID group utilization percentage Click a column heading to order the table by that column. Click a RAID group to view the corresponding RAID group details. For more information, see “RAID Group Information” (page 224). Viewing LDEV data in custom groups To view the data on LDEVs that belong to a custom group: 1. Click Array View in the left pane. 2.
10 Using charts This chapter discusses the following topics: • “Introduction” (page 229) • “Plotting charts” (page 233) Introduction You can plot performance graphs to view historical data of components that belong to the same or different XP disk arrays and P9000 disk arrays. Graphical representation of components performance metrics is especially useful when you want to compare similar components of different XP and P9000 disk arrays to determine their performance and observe trends.
Figure 26 Charts screen 1 Charts controls 2 Component selection tree for charts 3 Available Metrics Choose Metric Category list from where you select metrics for components 4 Chart settings 5 Zoom preview panel 6 Chart window (blue border indicates that the chart window is selected or active) Click the black Up arrow positioned at the top right corner of the Data Source and Chart Settings sections to collapse those sections. Click the black Down arrow to restore the sections.
Sections Description ◦ Snapshot Pool ◦ Pools ◦ Replication Volumes ◦ LUSE ◦ Host Groups ◦ Ext-RG(s) ◦ Drive Types In addition to the above listed, the MP Blades category is also displayed for the P9000 disk arrays. • Custom groups The custom groups that you created appear. When you click a custom group, all the LDEVs that belong to the custom group are displayed for your selection. For more information on creating custom groups, see “Creating custom groups” (page 82).
Sections Description Chart Work Area The Chart Work Area consists of the following: • The individual chart windows that display the performance graphs of components for the selected metrics. • The chart controls that can be used to perform various tasks on the individual chart windows. • The zoom preview panel, where you can preview performance of components for a specified duration. For more information, see “Viewing charts” (page 268).
Plotting charts NOTE: The figures in the following procedure are an example for the XP disk array metric selection. Prerequisite Ensure that the following prerequisites are met before you navigate to the Charts screen: • You have collected the performance data, so that the data on associated components is displayed under the various categories for the individual XP and P9000 disk arrays.
component selection tree, if you are aware of the LDEV name. For more information, see “Searching for components” (page 265): • Click the plus (+) sign for an XP or a P9000 disk array and select components from the list, for which you want to view the performance graphs. The following image displays the hierarchy for component selection. For more information on selecting components, see “Selecting components and metrics” (page 235).
3. Choose the metrics for which you want to view the performance of the selected components. For more information, see “Choosing metrics” (page 237). By default, the most used metric category and related category metrics are listed. A performance graph for the selected component and metric is automatically displayed in the Chart Work Area. 4.
XP or P9500 Disk Array main categories – component selection Description tree For a P9000 disk array, Front-end comprises of the frontend components, such as the ports and the associated CHAs. For more information, see “Front-end navigation path” (page 238). Cache Comprises of individual CLPRs. For more information, see “Cache navigation path” (page 240). MP Blades Comprises of individual MP blades and the associated processors. For more information, see “MP Blades navigation path” (page 242).
XP or P9500 Disk Array main categories – component selection Description tree displayed for a P9000 disk array. For more information, see “Host Groups navigation path” (page 256). Ext-RG(s) Comprises of the external RAID groups that are managed by the XP and P9000 disk arrays. For more information, see “Ext-RG(s) navigation path” (page 260). Drive Types Comprises of the individual drive types that are available on the selected XP and P9000 disk arrays.
based on the metric category to which they belong. Select a metric to view the corresponding performance graph in the Chart Work Area. You can also click the Metric check box to view performance graphs for all the metrics listed. The related metrics are displayed in the Available Metrics Choose Metric Category list, if you select a homogeneous set of components, where the selected components belong to the same component type within or across the XP and the P9000 disk arrays.
The Front-end main category comprises of the ports that further displays the associated MPs and CHAs. Following is the component selection path: Front-end >Port (component type) > Individual ports > Individual MPs > Individual CHAs. The port type, such as Fibre is displayed beside the port ID. In the above image, under Front-end for the XP disk array 10090 (XPArray_1): 1. Front-end is the main category. 2. Port is the component type.
The applicable metrics are displayed in the Available Metrics Choose Metric Category list. Select the metrics at the component type or the individual component levels, or both to view the related performance graphs in the Chart Work Area. For a description of these metrics, see “Metric Category, metrics, and descriptions” (page 388). The following table provides the default set of metric categories that are displayed in the Available Metrics Choose Metric Category list for the XP and the P9000 disk arrays.
IMPORTANT: CLPRs do not exist in an XP1024 Disk Array. So, the Cache related metrics are not displayed in the Available Metrics Choose Metric Category list when you select a disk array of type XP1024. In the above image, under Cache for the XP disk array 10055: • Cache is the main category. The number (6) indicates the number of CLPRs partitions configured on the selected XP disk array. • The CLPR0 and CLPR1 are the individual CLPRs.
Related Topics • “Front-end navigation path” (page 238) • “Back-end navigation path” (page 243) • “MP Blades navigation path” (page 242) • “Pools navigation path” (page 247) • “Snapshot Pool navigation path” (page 251) • “Replication Volumes navigation path” (page 253) • “LUSE navigation path” (page 254) • “Host Groups navigation path” (page 256) • “Ext-RG(s) navigation path” (page 260) • “Drive types navigation path” (page 261) • “Custom groups navigation path” (page 264) MP Blades na
In the above image, under MP Blades for the P9000 disk array 53036: • MP Blades is the main category. The number 2 indicates the total number of MP blades configured on the selected P9000 disk array 53036. • MPB-1MA is one of the individual MP blade IDs that belongs to the Cluster 1 and the blade location MA. • Processors is the component type. The number 4 indicates the total number of processors that belong to MPB-1MA. • MP 0 is one of the individual processors that belongs to MPB-1MA.
The Back-end main category comprises of the DKA pairs, associated MPs, RAID groups, and LDEVs, where DKA and RAID groups are the main component types that further expand to display the associated components. Following is the component selection path: • Back-end > DKA (component type) > Individual DKA pairs > MP (component type) > Individual MPs. • Back-end > RG(s) component type) > Individual RAID Groups.
In the above image, under Back-end for the XP disk array 10090: • • DKA is a component type. The number (2) indicates the number of DKA pairs available on the selected XP disk array. ◦ AUMU is an individual DKA pair ◦ BUNU is an individual DKA pair RG(s) is a component type. The number (6) indicates the number of RAID groups configured on the selected XP disk array. 1–1 to 1–6 are individual RAID groups. The list under 1–1 displays the following component types: ◦ Physical LDEVs.
In the above image, under Back-end for the P9000 disk array 53036: • DKA is a component type. The number (1) indicates the number of DKA pairs available on the P9000 disk array 53036. • AUMU is an individual DKA pair. • RG(s) is a component type. The number (12) indicates the number of RAID groups configured on the P9000 disk array 53036. 1–1 to 1–12 are the individual RAID groups. The list under 1–1 displays the following component types: ◦ Physical LDEVs.
Back-end category Most used default metric category For XP disk arrays For P9000 disk arrays RG(s) Backend Metrics Yes Yes Physical LDEVs Frontend IO Metrics Yes Yes Pool LDEVs Frontend IO Metrics Yes Yes Related Topics • “Front-end navigation path” (page 238) • “Cache navigation path” (page 240) • “MP Blades navigation path” (page 242) • “Pools navigation path” (page 247) • “Replication Volumes navigation path” (page 253) • “Snapshot Pool navigation path” (page 251) • “LUSE nav
In the above image, under THP Pool for the XP disk array 10090: • THP Pool is the main category. The number (2) indicates the total number of ThP pools configured on the XP disk array 10090. • Pool ID:126 is one of the individual ThP pools. • DKA is a component type and lists the DKA pairs associated with the ThP Pool ID:126. • LDEVs is a component types, and it lists the LDEVs associated with ThP Pool ID:126.
Pools > THP (component type) > Individual ThP pool IDs. Each individual ThP pool further includes the following: • LDEVs (component type) > Individual LDEVs > RG(s) (component type) > Individual RAID Groups assigned to the selected smart pool • VVols (component type) > Individual host group > Volumes (component type) > Individual LDEVs associated with a host group SMART The SMART comprises of the RAID groups and physical LDEVs, host groups and VVols, and tiers for the Smart pools.
• Pool ID:5 is a Smart pool. • RG(s) is a component type under Smart Pool ID:5 and lists the RAID groups that are associated with the Smart pool. RG(s) further expands to display the individual RAID groups and pool LDEVs associated with the Smart Pool ID:5. • VVols is a component type under Smart Pool ID:5 and lists the host groups that are associated with the Smart pool. The VVols are grouped based on the host groups.
Snapshot Pool navigation path The Snapshot Pool main category comprises of the snapshot pools that contain the associated RAID groups, LDEVs, and the associated host group's VVols. Following is the component selection path: Snapshot Pool > Individual snapshot pool IDs.
• • LDEVs is a component type. The number (4) indicates the number of Ldevs associated with the Snapshot Pool ID:25. ◦ 9:C9 is one of the individual LDEV. ◦ RG(s) is a component type. The number (1) indicates the Raid Group associated with the Snapshot Pool ID:7. VVols is a component type. The volumes listed under VVols are grouped based on host groups. The number (1) besides VVols indicates the total number of host groups using the Snapshot Pool ID:25.
• “Drive types navigation path” (page 261) • “Custom groups navigation path” (page 264) Replication Volumes navigation path The Replication Volumes main category comprises of the business copy and the continuous access volumes. They are the main component types that further expand to display the associated components.
The applicable metrics are displayed in the Available Metrics Choose Metric Category list. Select the metrics at the component type or the individual component levels, or both and view the related performance graphs in the Chart Work Area. For a description of these metrics, see “Metric Category, metrics, and descriptions” (page 388). The following table provides the default set of metric categories that are displayed in the Available Metrics Choose Metric Category list for the XP and the P9000 disk arrays.
Following is the component selection path: LUSE > Individual LUSE masters > Components (component type) > Individual LDEVs that belong to the selected LUSE master. The LUSE masters and their LDEVs have the associated RAID groups given in brackets beside the LDEV IDs (example, 1:44 (1—1)). The number of components associated with a component type is displayed beside it. For example: • LUSE (21) • Components (2) In the above image, under LUSE for the XP disk array 10090: • LUSE is a main category.
Related Topics • “Front-end navigation path” (page 238) • “Cache navigation path” (page 240) • “MP Blades navigation path” (page 242) • “Back-end navigation path” (page 243) • “Pools navigation path” (page 247) • “Snapshot Pool navigation path” (page 251) • “Replication Volumes navigation path” (page 253) • “Host Groups navigation path” (page 256) • “Ext-RG(s) navigation path” (page 260) • “Drive types navigation path” (page 261) • “Custom groups navigation path” (page 264) Host Groups
Following are the component selection path: • Host Groups > Individual host groups > Ports (component type) > Individual Ports. • Host Groups > Individual host groups > RG(s) (component type) > Individual RAID groups. At the individual RAID group level, you can view the average utilization of the RAID group by the associated LDEVs. The utilization shown is not specific to the host group to which the RAID group belongs.
• RG(s) is a component type under Host Group. The number (1) beside RG(s) displays the number of RAID groups assigned for Host Group. • 1-7 is a RAID group associated with Host Group. The number 44 beside 1-7 indicates the average utilization of RAID group 1-7 by all the LDEVs from different host groups. ◦ Physical LDEVs is a component type under RAID group 1-7. The number 911 indicates the number of physical LDEVs in RAID group 1-7. ◦ Pool LDEVs is a component type under RAID group 1-7.
In the above image, under Host Groups for the P9000 disk array 10090: • Under the main category Host Groups, XPPA247_HYP_V_NEW_BLD_BAY6 is one the individual host group. The number 0 indicates the aggregate of the average I/Os from each LDEV belonging to Host Group • A:2E is a PVol under the LDEVs node. • S-Vol is a component type under PVol. The number 1 beside S-vol displays the number of Svols assigned to the PVol. A:1E is an Svol that is associated with the PVol A:2E.
For ports that are configured to communicate with the selected host groups, you can also view the associated MPs and CHAs for the XP disk arrays, and only the CHAs for the P9000 disk arrays under the Front-end category. For the LDEVs that are associated with the selected host groups, view their RAID groups under the Back-end category. For more information, see “Front-end navigation path” (page 238) and “Back-end navigation path” (page 243).
The available metrics are displayed in the Available Metrics Choose Metric Category list. Select the metrics at the component type or the individual component levels, or both and view the related performance graphs in the Chart Work Area. For a description of these metrics, see “Metric Category, metrics, and descriptions” (page 388). The following table provides the default set of metric categories that are displayed in the Available Metrics Choose Metric Category list for the XP and the P9000 disk arrays.
IMPORTANT: When you plot the performance data points for a RAID group, the associated drive type is also displayed in the legend for the selected RAID group (Drive Type:, example: Drive Type: DKR2E-J146FC). The number of components associated with a component type is displayed beside it. For example: • Drive Types (1) • RAID Groups (6) • Physical LDEVs (884) In the above image, under Drive Types for the P9000 disk array 53036: • Drive Types is the main category.
performance graphs in the Chart Work Area. For a description of these metrics, see “Metric Category, metrics, and descriptions” (page 388). The following table provides the default set of metric categories that are displayed in the Available Metrics Choose Metric Category list for the XP and the P9000 disk arrays.
Custom groups navigation path The Custom Groups node comprises of individual custom groups that display the associated LDEVs. Following is the component selection path: • Custom Groups > Individual custom group > LDEVs (component type) > Individual LDEVs The serial numbers of the XP and the P9000 disk arrays to which the LDEVs belong are also mentioned in brackets beside the LDEV IDs. You can create a custom group that has multiple LDEVs from different XP and P9000 disk arrays.
• “LUSE navigation path” (page 254) • “Replication Volumes navigation path” (page 253) • “Host Groups navigation path” (page 256) • “Ext-RG(s) navigation path” (page 260) • “Drive types navigation path” (page 261) Searching for components You can navigate the Array tree by selecting an array from the array drop-down list and the component from the component drop-down list. The following components are supported for the search functionality: LDEV, RG, HG, Port, and Pool.
Using charts
Plotting charts 267
NOTE: • For the Raid Group, the Host Group branch is traversed first, followed by the Pool branch, Back-end, and finally the Drive Types branch. • You can search for External Raid Groups as well by selecting Raid Group from the component drop-down list and querying for a specific External Raid Group. • When searching for concatenated Raid groups, you should enter a part of Raid group name and not the entire name.
The Chart Work Area displays the following default settings. They are applicable across the chart windows until you select the other available options: • Time Line in the Chart Style list. This implies that the data points for the different components are plotted as a line graph. The breaks in the performance graphs can be observed, if there are missing performance data collection. • Duration as 1 hour.
NOTE: ◦ These selections work only on the active chart windows. ◦ If the total number of data points from all the performance graphs exceeds 500 in a chart window, the data points are not rendered to optimize the charting functionality in HP XP P9000 Performance Advisor. You can hover the pointing device over the line graphs to view the data points.
An individual chart window can accommodate the performance graphs for up to 250 components. The 250 components that you select can belong to multiple component types and for different metrics from the same metric category. Performance Advisor plots the performance graphs incrementally and continues till the performance graphs for all the 250 components are plotted in the chart window.
For more information on the tasks that you can perform in the Chart Work Area, see “Using chart controls and settings” (page 276). Viewing top 20 consumers of an MP blade IMPORTANT: This section is applicable only for the P9000 disk arrays. The top 20 consumers can be LDEVs, continuous access journal groups, or the E-LUNs (external volumes) that are assigned to an MP blade.
MP blade utilization by top 20 consumers Example (see Figure 27 (page 272)) whether the frontend or the backend requests have been high.
Select an MP blade from MP Blades in the component selection tree and choose the MP Blade Util/Processing Type metric in the Available Metrics Choose Metric Category list. For more information, see “MP Blades navigation path” (page 242). A stacked area graph is displayed in a separate Utilization Metrics chart window and displays the MP blade utilization split up for the different processing types. Each area represents the percentage of average MP blade utilization by an individual processing type.
Viewing aggregate data for metrics You can view the average utilization for the components in a metrics category using the Stacked button in the Charts screen. Select the required in the component selection tree, and then choose the appropriate metric for which you want to view the average utilization data in the Available Metrics Choose Metric Category list. NOTE: You can select a maximum of eight components. The system does not display the stacked chart if more that eight components are selected.
Aggregate Data Example (see Figure 29 (page 275)) Average utilization metrics value for the specific date and time stamp (average utilization metrics percentage for the specific date and time stamp) 12110 (68.4%) Sum of all the data points for the specific date and time stamp total: 17709 NOTE: In the stacked chart view, the system enables you to select more than eight components.
2. Click Add New to add a new chart window. The new chart window is automatically selected (blue border appears around the active chart window). The performance data points of components that you select in the component selection tree for metrics in the same metric category are added to the new chart window till you clear the selection.
3. Click Save to save the selected charts as favorite charts. You can provide a name for the favorite chart by clicking in the respective text box and entering the name. If you do not provide a name, by default, the metric category title of the chart window is considered as the favorite chart name. The following are a few points that you must note while specifying a favorite chart name: • The name should have only alphanumeric characters.
1. Click Load Fav Chart(s). A pop-up dialog appears displaying the favorites charts that you can view. 2. Select one or more favorite charts from the list and click View Chart. The favorite chart appears in the Chart Work Area and is selected by default. • You can add components for metrics in the same metric category to this favorite chart and save it with the same name, or provide a different name.
NOTE: • To create a report, it is mandatory that you provide the report name, array model, and report type. • The Report Name, Customer Name, Consultant Name, and Array Location are pre-populated in the respective fields if you have already configured them as common settings on the Email Settings screen. For more information, see “Configuring email and SNMP settings” (page 71). If you do not want these default descriptions, modify the respective fields.
7. Click Generate to view the report immediately. Click Save to save and view the report later. HP XP P9000 Performance Advisor saves the report in its database and also displays a record for the report in the Reports section (Reports+View Reports). By default, the new record is displayed at the end of the list. The following details along with those you provided while creating a report are displayed for the report record in the Reports section: • User Name: The name of the user who created the report.
Viewing current LDEV assignments for an MP blade IMPORTANT: This section is applicable only for the P9000 disk arrays. You can view the LDEVs that are assigned to an MP blade for the duration that you select in the Chart Work Area. This data helps you to identify the MP blade that is processing requests for an LDEV. Based on this data, you can perform the necessary action.
LDEV - MP blade assignment Example (see Figure 30 (page 282)) MPB-1MA is the MP blade ID, where 1 indicates the cluster # and MA indicates the blade location. Forecasting utilization You can forecast utilization of the following components in charts: • MP Util (%) • Write Pending (%) • DKA Util (%) • RG Util (%) • ThP Util (%) • MP Blade Util (%) IMPORTANT: • The forecast on the MP Util (%) and DKA Util (%) are available only for the XP disk arrays.
In the preceding utilization forecast graph, the threshold value is displayed as a blue reference line and the forecast appears as a green line. IMPORTANT: • Ensure that at least a minimum of 21 data points are available to begin the utilization forecast. • To forecast utilization for a week, HP recommends that there be a minimum of 250 data points or the performance data has been collected for two or more days.
points available when the chart is initially updated for 5 minutes. The data points appear in the next update cycle only for the delta duration. When you click Start Updating, the chart re-renders itself to show the new values that are collected from the host agent. The Start Time displays the time when the automatic update started, and the End Time displays Continuous Update.
by taking the average of the previous data points. You can specify the number of data points for which the average needs to be calculated, using the Point Factor list. The minimum that you can select from the Point Factor list are 2 points and the maximum are 24 points. IMPORTANT: • HP recommends that you select minimum Point Factors for accuracy and better view of the graph that is plotted. • Moving Average is calculated as the average of the initial set of data points.
provides you an approximate idea of the performance of components if the data collection was active during the specified time interval. Once the data collection resumes, the data points are again plotted simultaneously for the selected components.
Zooming in on data points across performance graphs In addition to zooming in on data points for a particular duration, you can also zoom in on a combination of data points in the chart window. If zoom preview is enabled, it also highlights the focused area in the chart window. To zoom in on data points in the chart window: • Holding down the mouse button, drag the pointer across the data points that you want to focus on. The chart window displays the focused set of data points.
In the Zoom Preview panel, if you plot the chart for more than one day, the chart displays data with date stamp. Rearranging or moving chart windows To move or rearrange chart windows in the Chart Work, click in the title bar of the chart window that you want to move and holding down the left mouse button, drag and drop that chart over an existing chart, where you want the new chart to be placed in the Chart Work Area.
Removing chart windows You can remove all the charts currently displayed in the Chart Work Area by clicking Close Charts. All the active and passive chart windows are removed from the Chart Work Area.
11 Using reports This chapter discusses the following topics: • “Generating, saving, or scheduling reports” (page 297) • “Viewing a report” (page 305) • “Viewing a schedule” (page 306) • “Virtualization for reports” (page 306) • “Logging report details and exceptions” (page 309) Introduction Reports provide history of performance data collected for a specified XP or a P9000 disk array, where a visual representation of the performance trend of components is shown for a duration that you specify.
Report types Description For XP disk arrays • Total I/O Rate Detail • Read-Write Ratio For P9000 disk arrays Performance report Findings section. • Read-Write Ratio by hour of day • Read-Write Detail • Max/Min Frontend Port IOPS • Max/Min Frontend Port MB/s In addition, it includes a section called Findings at the beginning of the report. ACP Utilization The ACP Utilization report Yes provides data on the utilization of various installed ACP/DKA pairs for the duration that you specify.
Report types Description For XP disk arrays For P9000 disk arrays and ranges from 8 - 128 for the frontend and the backend LDEVs, and 8 - 32 for the frontend and the backend RAID groups. For more information, see “Creating a report for the busiest LDEVs and RAID groups” (page 302). LDEV Activity The LDEV Activity report Yes provides data on the average performance and the utilization of LDEVs.
Report types Description For XP disk arrays For P9000 disk arrays snapshot volumes that are assigned to a pool. MP Blade Utilization The MP Blade Utilization report No provides data on the average utilization of each installed MP blade. In addition, the following are also included in the report for each MP blade: Yes • The top 20 consumers (LDEVs, continuous access journal groups, or E-LUNs) and their average utilization of the CPU cycles. • The average MP blade utilization by each processing type.
Report types Description For XP disk arrays For P9000 disk arrays Yes Yes components for the following: • Random Read • Random Read Cache • Random Write • Sequential Read • Sequential Read Cache • Sequential Write 2.
IMPORTANT: • • Reports on the following are available only if they are configured in the selected XP or P9000 disk array. If not configured, they are not even displayed as options to select for create their reports. In addition, they are also not displayed in other related reports, like the Array Performance and the All reports.
You can also edit or delete a schedule. For more information, see “Viewing a report” (page 305) and “Viewing a schedule” (page 306). Tasks you can perform on the Reports screen • “Generating, saving, or scheduling reports” (page 297) • “Viewing a report” (page 305) • “Scheduling reports” (page 300) • “Viewing a schedule” (page 306) Generating, saving, or scheduling reports You can generate a report, where you view only a temporary copy of the report.
2. Select or enter the following details: • Name of the report in the Report Name box. The name should not be less than 2 characters or exceed 80 characters in length. • Name of the customer or company in the Customer Name box. • Name of the consultant in the Consultant box. • Location for the array in the Array Location box. • Select one of the following: Array or Template or Host Group option from the Based on option. • Select the array type from the Array Type drop-down list.
You can also select multiple reports and view the corresponding data in a single report document. The data for each report is arranged based on the order in which you selected them while creating or scheduling a report. Use the Shift or the Ctrl key for selecting multiple reports. Alternatively, use the Up and the Down arrow keys with the Shift and the Ctrl keys. NOTE: • ◦ The LDEV Activity report output is always in a .csv format.
3. Generate or save the report. • To generate a report, click Generate. HP XP P9000 Performance Advisor does not save the report in its database or display records for the report in the Reports section (Reports+View Reports). Instead, view only a temporary copy of the report. The report cannot be retrieved once it is closed.
1. Collection Schedule: displays Daily, Weekly, and Monthly. By default, Weekly is selected as the collection schedule. • Day of the Week: Displays the list of week days. Select the week day when you want the schedule to be executed. By default, Weekly is selected as the default collection schedule. • If you select Monthly as the collection schedule, the Monthly Schedule is displayed. The following options are provided in a monthly schedule: • 2.
4. Click Save. HP XP P9000 Performance Advisor does the following: • Saves the schedule and also displays a record for the schedule in the Scheduled Reports section (Reports+View Reports). The following details along with those you provided while scheduling a report are displayed for that schedule in the Scheduled Reports section: ◦ Occurrence: Displays number of times a particular schedule is repeated. The occurrence is aligned to the selected schedule frequency.
frontend and eight backend LDEVs, and eight frontend and eight backend RAID groups. Further, the report displays the graphs for only those LDEVs that have the associated I/Os and those RAID groups on which the I/Os transactions have occurred. Consider the following example: A report is created to view 32 busiest frontend LDEVs and 16 busiest frontend RAID groups, and only eight of the selected 32 LDEVs and four of the selected 16 RAID groups are busy.
(page 297). In addition, ensure that the following steps specific to an LDEV Activity report are also completed: 1. Select LDEV Activity from the Report Type list. 2. 3. Select the Metric Type as: • FontEndIO: Select this metric type to view a report of the most active or the least active LDEVs (or both) based on the threshold specified for the total frontend I/Os.
Viewing reports IMPORTANT: • Report schedules with an asterisk (*) before the User Name indicate that they are generated by a schedule. Following is the naming convention for reports that have an associated schedule: _exportDB-_____
• “Viewing a schedule” (page 306) • “Logging report details and exceptions” (page 309) Deleting reports To delete a report: 1. Click Reports+View Reports in the left pane. 2. In the Reports section, select the check box for the report record that you want to delete. 3. Click Delete. Click OK when prompted to confirm. The report copy is also deleted from the :\HPSS\pa\tomcat\webapps\ pa\reports folder. Click Cancel to retain the records.
IMPORTANT: • The Scheduled Reports section appears only if you have logged in as an Administrator or a user with administrator privileges. • If the Email Dest for a schedule record is blank, it implies that the report is scheduled, but an email address is not provided or is invalid. In such cases, you do not receive any notification though the report is generated. You need to go to the following location and select the report you want to view: :\HPSS\pa\tomcat\webapps\pa\reports.
In the preceding image, you can view the report, PA_ACP_Rep that is executed on 2009-10-11 20:11:32 IST (Generation Time). The report provides data on ACP Utilization in an XP disk array, 82502 for a period of 1 month (2009-09-11 to 2009-10-11). The report is provided in HTML format. The Email Dest column is blank for this record, which implies that a schedule is not created for this report.
P9000 Performance Advisor is supposed to generate a report on the second Thursday of every month at 00:00 hours. Hence, the schedule is active and a report is generated on 11th September 2008 at 00:00 hours. The End Time for this schedule displays 12.11.2008 00:00:00, which means the last report that HP XP P9000 Performance Advisor generates is on 11th December 2008 at 00:00 hours. This is because, while creating the schedule, the number of times it should repeat is given as 4 in the Occurrence box.
12 Using Performance Estimator for XP and P9000 disk arrays This chapter discusses the performance estimation for XP and P9000 disk arrays. Introduction HP XP P9000 Performance Advisor enables you to determine the optimal performance of your XP (XP24000, XP12000) and P9000 (P9500) Disk Arrays after configuration collection is complete for these XP disk arrays. It provides a framework called the Performance Estimator for estimating their performance.
• Disk type –15K RPM • RAID type and RAID groups –144 RAID groups for RAID 1 (2D+2D) • Workload – 8K Random Writes • Intensity – 4096 threads/sec HP XP P9000 Performance Advisor estimates: • 576 disks (Number of Disks) are required • I/Os on the disk set would be 46442/sec • MB/s that the array can receive per second would be 380 MB • Time taken for the array to respond (R.T (ms) for the read—write requests would be 91 R.
maximum of 288 RAID groups for RAID 1 (2D+2D) and 144 RAID groups for RAID 5 (7D+1P). Accordingly, the text box on the right side of the # RGs horizontal scroll bar displays the selected number of RAID groups. The RAID groups number varies depending on where you place the triangular button on the horizontal scroll bar. You can also enter a different RAID group number, increment, or decrement this number using the triangular buttons that appear next to the text box. d. e.
Based on the above selection, the Performance Estimator displays the estimated values in the following non-editable text boxes: • Raw Capacity - Indicates the cumulative disk space that is available (for both data storage and parity operations) for the selected configuration. • R1/R5/R6 Usable (GB) - Indicates the disk space that is available as data storage for the selected configuration. The value shown is applicable only for the R1 and R5 RAID types.
maximum of 512 RAID groups for RAID 1 (2D+2D) and 256 RAID groups for RAID 5 (7D+1P). Accordingly, the text box on the right side of the # RGs horizontal scroll bar displays the selected number of RAID groups. The RAID groups number varies depending on where you place the triangular button on the horizontal scroll bar. You can also enter a different RAID group number, increment, or decrement this number using the triangular buttons that appear next to the text box. d. e.
Based on the above selection, the Performance Estimator displays the estimated values in the following non-editable text boxes: • Raw Capacity - Indicates the cumulative disk space that is available (for both data storage and parity operations) for the selected configuration. • R1/R5/R6 Usable (GB) - Indicates the disk space that is available as data storage for the selected configuration. The value shown is applicable only for the R1 and R5 RAID types.
13 Troubleshooting issues for components associated with applications This chapter discusses troubleshooting issues for disk array components associated with applications that reside on hosts, which communicate with the disk arrays. The troubleshooting is possible using the real-time charting or using the host group or WWNs of the hosts.
you can collect the real-time performance data for a set of five LDEVs, RAID groups, ports, cache, and MP blades in a P9000 disk array. This data is collected for a set of real-time metrics that HP XP P9000 Performance Advisor supports. When you start a real-time performance data collection for an XP or a P9000 disk array, the following sequence of steps follows: 1.
Figure 32 RealTime screen Screen elements Description Start Collections tab • After the configuration data is collected for the XP or the P9000 disk arrays, they are displayed for selection in the Select Components list, under Start Collections tab. • The disk array components are displayed for each XP or P9000 disk array.
Screen elements Description You can select the XP or the P9000 disk array and related components for which you want to collect the real-time performance data. Stop Collections tab Displays the XP and the P9000 disk arrays for which real-time performance data collection is in progress. You can stop a real-time data collection any time during the collection process.
You must wait for the real-time server update to complete if you want to use the same host agent. Ensure that the above-mentioned steps are performed before you initiate a real-time performance data collection for a P9000 disk array (such as the P9500) or for the following XP disk array models: XP24000, XP20000, XP12000, or XP10000.
Additionally, the following are displayed: 3. • HostAgent list: Displays the host agent that is connected to the selected XP or P9000 disk array. • Command device list: Displays the command devices for the selected XP or P9000 disk array. These command devices communicate with the host agents displayed in the HostAgent list. • Choose Metrics list: Displays the set of real-time metrics based on the category that you select. Click the plus (+) sign for a component category to view the associated list.
7. 8. From the Choose Metrics list, select the check boxes for the real-time metrics of your choice. For more information on the real-time metrics, see “Real-time metrics and descriptions” (page 404). Click Start Plotting. HP XP P9000 Performance Advisor plots the performance graphs in the Chart Work Area as and when the real-time performance data is collected for the selected components. For more information on using charts, see “Plotting charts” (page 233).
3. 4. Select the XP or the P9000 disk array for which you want to stop the real-time performance data collection. Click Stop Plotting. The real-time data collection stops and the record removed from the list for the selected XP or P9000 disk array. Troubleshooting using host group or WWN Introduction HP XP P9000 Performance Advisor helps identify bottlenecks in the performance of applications that reside on hosts and use the XP and the P9000 disk arrays for storing their data.
IMPORTANT: • An application can reside on multiple hosts that connect to the XP and the P9000 disk arrays. • A host group can have multiple WWNs to connect to an XP or a P9000 disk array. • The data displayed on the Troubleshooting screen only enables your analysis of the issue and arriving at a probable solution. This screen does not provide a resolution for the issue.
• Know the WWNs for the hosts. Run the XPInfo command at the command prompt of the host where your application resides. The HBA Port WWN in the P9000Info output provides the WWN number. If your host does not have P9000Info, download the executable from the Support screen in HP XP P9000 Performance Advisor (click Support on the Dashboard screen) and install on the host.
The following image shows the Configure Application dialog box for 53040, which belongs to the P9500 Disk Array type. The following are the possible combinations: 7. • Associate a new application with a new host group or WWN. • Associate an existing application with a new host group or WWN. Click Add/Remove. You are shown an informational message that the application settings are saved. 8. 9. Click Close to come back to the Troubleshooting screen.
4. 5. 6. Click Remove. Under Application Name, select the application that you want to remove. Click Add/Remove. You are provided an informational message that the application settings are removed. 7. Click Close to come back to the Host Based screen.
The Search Results dialog box appears and displays the application and the host group or WWN of the host that are associated with the component. 4. Click the link provided for the application, host group, or WWN in the Search Results dialog box. If your application is associated with a host using its host group, N/A is displayed under the WWN column. Similarly, if your application is associated with a host using its WWN, N/A is displayed under the Host Group column.
1. Click the plus (+) sign for an XP or a P9000 disk array in the component selection tree under Troubleshooting+Host Based. The list expands to display the configured applications. The applications displays the associated host groups or WWNs. You can also search for an application that is using the components in an XP or a P9000 disk array. For more information, see “Searching for applications associated with components” (page 327).
2. Based on your requirement, select an application or choose the host group or the WWN associated with an application: If your selection is at the application level, the data displayed for the LDEVs and the associated components is through all the host groups or WWNs associated with the application. Hence, the data is a superset of the data that you view at the host group or the WWN level.
Click an LDEV ID to view the associated port, CLPR, and the RAID group records highlighted in the respective tables. By default, the port, CLPR, and the RAID group records are displayed for the first LDEV listed in the LDEV table.
In addition, the following are displayed: • The MP blade ID with its corresponding average utilization percentage in brackets. For example, MPB-1MA [9.34]. MPB-1MA is the MP blade ID that belongs to the Cluster 1 and the blade location MA. Its average utilization percentage is 9.34%. • The replication status for the LDEVs under Replication Attribute. This data helps you to understand if a particular LDEV is being used as a replication volume (continuous access or business copy volume).
In addition, the following details are also displayed: • RAID group table: ◦ DKA Pair: Displays the DKA pair associated with the particular LDEV. ◦ RG: Displays the RAID group number associated with the particular LDEV. ◦ Pool ID: Displays the ThP pool ID. NOTE: For XP disk arrays prior to the XP24000 Disk Array, NA is displayed under Pool ID, as the ThP cannot be configured on XP disk arrays prior to the XP24000 Disk Array.
(page 104). For more information on setting threshold values, see “Configuring dashboard threshold settings” (page 97). You can also forecast the component utilization based on the array type. • For an XP disk array, forecast the DKA, RAID group, cache write pending, and the MP utilization. • For a P9000 disk array, forecast the cache write pending, MP blade, and the RAID group utilization. For more information, see “Forecasting utilization” (page 283).
The additional set of metrics that HP XP P9000 Performance Advisor supports for the RAID groups, Ports, and the CLPRs are as follows: Table 29 Additional metrics for RAID groups, ports, and CLPRs Resources Additional Frontend, Cache, and Backend metrics Description RAID groups Non Seq Reads The total backend tracks loaded in random mode for a specified RAID group. Seq Reads The total backend tracks loaded in sequential mode for a specified RAID group.
the XP disk arrays), and the MP blades (applicable only for the P9000 disk arrays) to take the appropriate action. HP XP P9000 Performance Advisor analyses the previous average read and write response values of an LDEV for the duration that you specify in the User Settings screen (see “Setting the duration to predict the LDEV response time” (page 77)).
Plotting charts You can select and plot charts for components in the LDEVs, Port, CLPR, and the RAID group tables. To plot charts for the selected components and metrics: 1. On the Troubleshooting screen, select components for which you want to plot charts. The components can belong to the LDEV, Port, CLPR, and the RAID Group tables. While selecting the records, press the Shift key for the sequential selection of multiple components or the Ctrl key for the random selection of multiple components. 2.
Issue 1 High utilization of CHA MP on port 5A causing response time to increase for all LDEVs associated with the application. The MP in question manages another port (7A) whose IOPS are high in number causing the MP utilization to go up. Port 7A does not have any LDEVs mapped to the host in question. Steps for troubleshooting: 1. Launch HP XP P9000 Performance Advisor. 2. Navigate to the troubleshooting screen. 3. Select the XP array. 4. Select the application. 5.
9. Based on the trend of the utilization values of the RG and its LDEVs, the reason for poor response time on LDEV2 could be attributed to the overloading of the RG 1-2. Also, it could be inferred that RG 1-2 is “hot” due to the heavy load generated by all the LDEVs. In case the LDEV loads are not balanced, the possible solution could be to relocate some of the busy LDEVs on to another RG. 10. Generate a report of the findings above.
14 Launching HP XP P9000 Performance Advisor from other Storage products Introduction You can launch HP XP P9000 Performance Advisor from P9000 Tiered Storage Manager and P9000 Remote Web Console. Launching HP XP P9000 Performance Advisor from HP XP P9000 Tiered Storage Manager IMPORTANT: This section is applicable only for the XP disk arrays.
Viewing performance graphs for LDEVs To access HP XP P9000 Performance Advisor from P9000 Tiered Storage Manager and view the charts for the LDEVs that belong to a storage domain: 1. On HP P9000 Command View Advanced Edition Suite, click the Mobility tab to view the list of the logical groups created. The logical groups contains the list of volumes which are grouped logically to migrate. 2.
7. Enter your user name, password, and click Login. By default, the Frontend IO Metrics chart window appears in the Chart Work Area displaying the performance graphs for the selected LDEVs. You can also select additional metrics from the Available Metrics Choose Metric Category list. For more information, see “Plotting charts” (page 233). NOTE: Once you login, the current session is valid for 24 hours.
5. Click Analyze Performance. The HP XP P9000 Performance Advisor Login page is displayed. 6. Enter your user name, password, and click Login. By default, the Frontend IO Metrics chart window appears in the Chart Work Area displaying the performance graphs for the selected RAID group. You can also select additional metrics from the Available Metrics Choose Metric Category list. For more information, see “Plotting charts” (page 233). NOTE: Once you login, the current session is valid for 24 hours.
provisioning decisions. HP XP P9000 Performance Advisor displays usage data for the following components: • Parity groups or RAID groups • MP blade processors or MP blades • Logical Devices or LDEVs • Host groups NOTE: This section covers tasks that must be completed to launch HP XP P9000 Performance Advisor from P9000 Remote Web Console. For more information on Remote Web Console, see the product documentation.
Updating the management station IP address and session name 1. 2. Navigate to the folder on your P9000 disk array SVP where you copied the XML files. Do one of the following: • To update the IP address, open the appDefinition.xml file in Notepad and update the HP XP P9000 Performance Advisor management station IP address for the tag as shown: Syntax:
IMPORTANT: Whenever you update the appDefinition.xml file for the management station IP address or the appProfile.xml file for the session name, execute the above-mentioned commands, so that P9000 Remote Web Console uses the latest XML files to launch the HP XP P9000 Performance Advisor session. Also, if a session of P9000 Remote Web Console is already open, log out and log in to view the updated session details.
5. Click Settings+Launch Application+Performance Advisor. If you have updated a different session name in the appDefinition.xml file, that session name appears when you click Settings+Launch Application. NOTE: If none of the components are selected, the session will be in the disabled mode. The session is enabled only when you select a particular component. Figure 34 HP P9000 Remote Web Console screen The session opens in a separate browser window.
5. Click Settings+Launch Application+Session Name (default: Performance Advisor). The data for the selected processor blade is displayed in the HP XP P9000 Performance Advisor, Array View - MP Blades screen. If multiple processor blades are selected, the data related to the first selected processor blade is displayed. For more information on MP Blades screen, see “Viewing MP blade utilization for P9000 disk arrays” (page 190).
The following image shows the processing distribution for MPB-1MA. To view the utilization data for MPB2, click MPB-2MC in the MP Blade Configuration group box in the Array View - MP Blades screen. Viewing Parity Group data Consider the scenario of five RAID groups (preferably belonging to the same drive type). You want to know which is the least busiest RAID group, so that you can provision storage space from the RAID group to create new LDEVs in that RAID group.
4. Click Settings+Launch Application+Session Name (default: Performance Advisor). By default, the utilization data for the Overall RAID Group utilization metric is displayed in the Utilization Metrics chart window. The overall RAID group utilization is the total busy rate of the RAID group over an entire collection interval. When a RAID group is associated with a ThP pool, this metric provides the extent to which a RAID group is busy because of the I/Os occurring on a ThP pool.
1. 2. 3. 4. Complete steps 1 and 2 mentioned for “Launching HP XP P9000 Performance Advisor” (page 346). Select Logical Devices in the list displayed for the P9000 disk array serial number. In the right work area, select the Logical Device record for which you want to view the usage and performance data in Performance Advisor. Click Settings+Launch Application+Session Name (default: Performance Advisor).
4. Click Settings+Launch Application+Session Name (default: Performance Advisor). The host group and the usage data of ports and LDEVs associated with the selected host group are displayed in the Array View - LDEV screen. The above image displays the LDEVs and ports associated with the host group san-ita1. The Chart Work Area in the above image displays the maximum, minimum, and average I/O on the port CL2D that is selected in the Array View - LDEV screen.
Sample on appDefinition.xml and appProfile.xml files • appDefinition.xml file http://16.181.45.100 • appProfile.xml file PAGE 354• V6-1 enables you to view data related to LDEV in HP XP P9000 Performance Advisor. It is also known as Logical Devices in HP XP P9000 Performance Advisor. For example, if V6-1 is deleted in the appProfile.xml file, the LDEV application menu item does not appear for selection in the P9000 Remote Web Console. • V7-4 enables you to view data related to Ports/Host Groups in HP XP P9000 Performance Advisor. For example, if V7-4 is deleted in the appProfile.
15 Support and other resources Contacting HP HP technical support For world wide technical support information, see the HP support website: http://www.hp.
Websites • HP.com http://www.hp.com • HP Storage http://www.hp.com/go/storage • HP Manuals http://www.hp.com/support/manuals • HP download drivers and software http://www.hp.com/support/downloads • HP Software Depot http://www.software.hp.
Typographic conventions Table 31 Document conventions Convention Element Blue text: Table 31 (page 357) Cross-reference links and email addresses Blue, underlined text: http://www.hp.
A Appendix A Storage management logical partitions (SLPRs) A disk array can be shared with the multiple organizations and with multiple departments within an enterprise. Therefore, multiple administrators might manage a single disk array. This circumstance creates the potential for an administrator to destroy volumes of other organizations, and it can complicate and increase the difficulty of managing the disk array.
host. This approach minimizes the effects of one administrator's operations on the volumes of other administrators. Figure 36 Example of a CLPR “Example of a CLPR” (page 359) displays how a corporation's cache memory is partitioned to three virtual cache memories. Although the Branch A host is inputting and outputting a large amount of data, the Branch B and Branch C hosts are unaffected because each branch is allocated 40 GB CLPR.
B Sample reports Report types HP XP P9000 Performance Advisor supports report generation for the following categories: • “Array performance reports” (page 360). • “LDEV IO reports” (page 368). • “RAID Group Utilization Report” (page 371). • “Cache utilization reports” (page 371). • “ACP utilization reports” (page 374). • “CHIP utilization reports” (page 375). • “XP Thin Provisioning (THP) pool occupancy” (page 378). • “Snapshot pool occupancy” (page 378).
NOTE: The backend transfer is the block of data that is transferred between the XP or the P9000 disk array cache and the RAID groups. Every read cache miss results in a backend transfer. A sample of each report is given below: Total I/O Rate report The Total I/O Rate report displays in a chart format, the number of total read and write I/O operations over the entire period. “Total I/O Rate” (page 362) displays a sample Total I/O Rate report for the P9500 Disk Array.
Figure 37 Total I/O Rate The total backend transfers may be compared to the total frontend I/Os and the difference is due to the effects of the array cache. The total backend transfers load is taken by the RAID groups and ACP/DKA pairs, where as the total frontend I/O load is taken by the CHIP/CHA ports. NOTE: If there are no data points available for the dates selected, a blank chart is displayed.
Figure 38 Total I/O Rate by hour of day The total backend transfers may be compared to the total frontend I/Os and the difference is due to the effects of the array cache. The total backend transfers load is taken by the RAID groups and ACP/DKA pairs, where as the total frontend I/O load is taken by the CHIP/CHA ports. NOTE: If there are no data points available for the dates selected, blank chart is displayed.
Figure 39 Total I/O Rate Detail The sequential frontend I/Os are when data is read from or written to consecutive addresses. The random frontend I/Os are when applications address non-consecutive blocks of data. CFWs are a special class of I/Os generated by HP's P9000 Continuous Access Remote Mirroring software. NOTE: If there are no data points available for the dates selected, blank chart is displayed.
Figure 40 Read/Write Ratio For example, the data point of X on the graph indicates X% read activity and (100-X)% of write activity. NOTE: If there are no data points available for the dates selected, blank chart is displayed. If all the data values are zero for the dates selected, a chart with a horizontal line along X axis is displayed in the center of the chart.
Figure 41 Read/Write Ratio by hour of day NOTE: If there are no data points available for the dates selected, blank chart is displayed. If all the data values are zero for the dates selected, a chart with a horizontal line along X axis is displayed in the center of the chart. Read/Write Detail report The Read/Write Detail report displays in a chart format, the total I/Os separated into different I/O types.
Figure 42 Read/Write Detail NOTE: If there are no data points available for the dates selected, blank chart is displayed. If all the data values are zero for the dates selected, a chart with a horizontal line along X axis is displayed in the center of the chart. Max/Min Frontend Port IOPS report The Max/Min Frontend Port IOPS report displays in a chart format, the total maximum and minimum frontend port I/O operations per second over the entire data collection period.
NOTE: If there are no data points available for the dates selected, blank chart is displayed. If all the data values are zero for the dates selected, a chart with a horizontal line along X axis is displayed in the center of the chart. Max/Min Frontend Port MB/s report The Max/Min Frontend Port MB/s report displays in a chart format, the total maximum and minimum frontend port MB/s over the entire data collection period.
In the LDEV I/O Mapping table: • Hyphen (-) is displayed in the RAID Format column if that RAID format is not applicable for THP Pool V-Vols. • Hyphen (-) is displayed in the LUSE Master column if the LDEV record is not a LUSE Master. So, the LDEV will either be a LUSE component or an individual volume (not part of any LUSE). • Hyphen (-) is displayed in the LUSE Status column if the LDEV record is neither a LUSE master nor a LUSE component. The LUSE Status is not applicable for such LDEV records.
throughput of the hardware. The maximum throughput varies depending on RAID level, disk mechanism type, and other factors such as the size of the individual I/Os. “Total Backend I/O Rate First Top 8 Array Groups” (page 370) displays a sample Total Backend I/O Rate First Top 8 RAID Groups report for the XP1024 Disk Array.
Figure 48 Total Frontend I/O Rate First Top 8 Array Groups/Pools RAID Group Utilization Report The Raid Group Utilization report consists of four charts that display the utilization of the top 32 RAID groups, split into eight each. The RAID group utilization indicates the total utilization of a RAID group over an entire collection interval.
Cache Utilization report The Cache Utilization report displays in a chart format, the cache utilization in an XP or a P9000 disk array. “Cache Utilization” (page 372) displays a sample Cache Utilization report for a P9500 Disk Array. Figure 50 Cache Utilization Cache Write Pending report The Cache Write Pending report displays in a chart format, the amount of data in the cache waiting to be written to a disk. It helps determine the amount of cache available.
Figure 52 Percentage read hits Total Backend Transfer report The Total Backend Transfer report displays in a chart format, the total number of transfers, sequential, random drive-to-cache, and cache-to-drive, per second. “Total Backend Transfer report” (page 373) displays a sample Total Backend Transfer report for a P9500 Disk Array.
Figure 54 Total Backend Transfer by Hour of the Day Cache Side File Utilization report The Cache Side File Utilization report displays in a chart format, the cache side file utilization. The cache side file utilization is used for the P9000 Continuous Access Async Software. It holds the data buffers that have not been acknowledged by the remote host. “Cache Side File Utilization” (page 374) displays a sample Cache Side File Utilization report for a P9500 Disk Array.
Figure 56 ACP utilization over the entire period ACP Utilization by Hour of the Day report The ACP Utilization by Hour of the Day report displays in a chart format, the average utilization of the installed ACP/DKA pairs over a 24-hour period. “ACP utilization over a 24-hour period” (page 375) displays a sample ACP Utilization by Hour of the Day report for an XP24000 Disk Array.
The CHIP utilization reports allow you to view in a chart format, the utilization data for all the installed CHIPs/CHAs in the array, and the average utilization data for all the installed CHIPs/CHAs in an XP disk array. While generating a CHIP utilization report, you can select one or more CHIPs from the Available CHIPs list. If you select All and set the long duration, HP XP P9000 Performance Advisor takes more time to generate the reports.
Figure 58 CHIP Utilization CHIP Utilization by Hour of the Day report The CHIP Utilization by Hour of the Day report displays in a chart format, the utilization data for all the installed CHIPs/CHAs in the array averaged over a 24-hour period. “CHIP Utilization by Hour of the Day” (page 377) displays a sample CHIP Utilization by Hour of the Day report for an XP24000 Disk Array.
Figure 60 CHIP Processor Utilization In this sample report, the individual MP utilization for the CHA 1E is displayed. Similarly a report is generated for all the installed CHIPs/CHAs. ThP Pool Occupancy report The THP Pool Occupancy report provides the usage percentage of the eight busiest ThP pools. NOTE: HP XP P9000 Performance Advisor reports only those ThP volumes in an XP or a P9000 disk array that are assigned to a pool.
NOTE: HP XP P9000 Performance Advisor reports only those snapshot volumes in an XP or a P9000 disk array that are assigned to a pool. “Snapshot pool occupancy” (page 379) displays a sample Snapshot Pool Occupancy report for 53040, which is a P95000 disk array type array. Figure 62 Snapshot pool occupancy P9000 Continuous Access Journal Group utilization report The Journal Pool Utilization report displays the utilization percentage of the eight busiest Journal groups.
LDEV Activity report You can view the maximum and least busiest LDEVs in an XP or a P9000 disk array through the LDEV Activity report. The LDEV data can be for one of the following metric types: • FontEndIO • BackEndIO • MB • Utilization • Read Response Time • Write Response Time The maximum and least busiest LDEVs are collated based on the maximum and minimum threshold levels you specify, and also the metric type that you select.
IMPORTANT: • The threshold limits that you specify are independent of each other and applicable to only the category that you select. You can set both the maximum and minimum threshold levels, or one of them based on your requirement. • The report also provides the associated drive types for the LDEVs. This information helps you to identify if the associated drive is supporting the required LDEV performance. If not, move the LDEV to a different drive type.
IMPORTANT: • The All report type for an XP or a P9000 disk array includes reports on the journal pool utilization, ThP pool, and the snapshot pool occupancy, only if they are configured in the selected XP or the P9000 disk array • Individual CHIPs have been removed from the All report. . MP blade utilization report The MP Blade Utilization report can be generated only for the P9000 disk arrays.
MP blade utilization by the processing types The average MP blade utilization split up for the different processing types is displayed in a chart for the selected duration. The duration for which the MP blade was busy processing consumer requests is also displayed as the Total Busy Time. For more information on processing types, see “Viewing MP blade utilization by processing types” (page 273).
C Appendix C Supportability matrix The following matrix displays the supportability of ThP, snapshot, and continuous access journal volumes on the XP arrays.
D Appendix D Array mapping To correctly map the ACP and CHIP pairs, see the following tables for the respective array: “XP128 (1 ACP Pair)” (page 385) lists ACP and CHIP pairs for disk array XP48/128. NOTE: The cards are lettered A-M, omitting I.
Table 36 XP12000 Slot name Pair ID Slot ID A, M ACP Pair 1 ACP A = 0; M = 4 B, N ACP Pair 2 ACP B = 1; N = 5 L, X ACP Pair 3 ACP L = 2; X = 6 K, W ACP Pair 4 ACP K = 3; W = 7 E, Q CHIP Pair 1 CHIP E = 0; Q = 4 F, R CHIP Pair 2 CHIP F = 1; R = 5 G, T CHIP Pair 3 CHIP G = 2; T = 6 H, U CHIP Pair 4 CHIP H = 3; U = 7 A, M CHIP Pair 5 CHIP A = 8; M = 12 B, N CHIP Pair 6 CHIP B = 9; N = 13 L, X CHIP Pair 7 CHIP L = 10; X = 14 K, W CHIP Pair 8 CHIP K = 11; W = 15 “XP10000 and
Table 38 XP24000 (continued) Slot name Pair ID Slot ID EL, QL CHIP Pair 3 CHIP EL=1; QL=9 FL, RL CHIP Pair 4 CHIP FL=3; RL=11 GU, TU CHIP Pair 5 CHIP GU=4; TU=12 HU, UU CHIP Pair 6 CHIP HU=6; UU=14 GL, TL CHIP Pair 7 CHIP GL=5; TL=13 HL, UL CHIP Pair 8 CHIP HL=7; ,UL=15 AU, MU CHIP Pair 9 CHIP AU=16; MU=24 BU, NU CHIP Pair 10 CHIP BU=18; NU=26 AL, ML CHIP Pair 11 CHIP AL=17; ML=25 BL, NL CHIP Pair 12 CHIP BL=19; NL=27 LU, XU CHIP Pair 13 CHIP LU=20; XU=28, KU, WU CHIP Pa
E Metric Category, metrics, and descriptions Metrics and descriptions “Metric Category, metrics, and descriptions” (page 388) provides the metric categories and metrics that are available in each of the metric categories, and the metric descriptions. Table 40 Metrics and descriptions Metric category Metric Description Frontend IO Metrics ACP Total IO – Frontend The total frontend I/Os (random plus sequential) on all the RAID groups managed by the ACP pair.
Table 40 Metrics and descriptions (continued) Metric category Metric Description Total Random Read-Frontends The total random frontend reads rate on this external volume during the entire collection interval. Total Random Reads Cache Out of the total random Hit-Frontend frontend reads rate on this external volume, the number of random reads available in the cache. Total Random Write Frontend The total random frontend writes rate on this external volume during the entire collection interval.
Table 40 Metrics and descriptions (continued) Metric category Metric Description LDEV, the number of random reads available in the cache. LDEV Random Writes – Frontend The total random frontend write I/Os on this LDEV during the entire collection interval. LDEV Total Sequential IO – Frontend The total sequential frontend I/Os rate on this LDEV over an entire collection interval. LDEV Sequential Reads – Frontend The total sequential frontend I/Os rate on this LDEV for a given range of time.
Table 40 Metrics and descriptions (continued) Metric category Metric Description example, if collection interval is set to five minutes, the maximum port IO value is collected and verified against the previous value every one minute, and the highest port I/O value collected in the last five minutes is considered. Average Port IO – Frontend The average frontend I/Os rate on this port over an entire collection interval. Port Average IO shown in PA is average of average IO.
Table 40 Metrics and descriptions (continued) Metric category Metric Description Total IO Writes – Frontend The total IO writes of all the LDEVs created in a specified RAID group for the given Host group over the entire data collection interval. The total IO writes is obtained by summing up IO writes of all the LDEVS for the given host group.
Table 40 Metrics and descriptions (continued) Metric category Metric Description Total Random IO - Frontend The sum total of random frontend I/Os on individual Virtual volumes defined in this pool. Total Random Reads Frontend The sum total of random frontend read I/Os on individual Virtual volumes defined in this pool. Total Random Read Cache Hits - Frontend The sum total of random frontend read I/Os on individual virtual volumes defined in this pool, which are serviced from the cache.
Table 40 Metrics and descriptions (continued) Metric category Metric Description Total Random Write Frontend The frontend I/Os for random write requests that result in cache hits, for all the snapshots in a snapshot pool. Total Sequential IO Frontend The frontend I/Os for sequential I/Os for all the snapshots in a snapshot pool. Total Sequential Reads Frontend The frontend I/Os for sequential read I/Os for all the snapshots in a snapshot pool.
Table 40 Metrics and descriptions (continued) Metric category Metric Description NOTE: This metric is disabled in the Alarm screen. Tier IOPS per Time Total number of I/Os on a pool tier over the collected monitoring cycles in a given duration. IO Buffer count Average value of the I/O buffer count in a sampling time for the selected MP Processor. NOTE: This metric is disabled in the Alarm screen.
Table 40 Metrics and descriptions (continued) Metric category Metric Description read from or written to the port in the last 30 seconds of the collection interval. Average Port MB – Frontend The average frontend throughput in MB/s that was read from or written to the port over an entire collection interval. Total MB – Frontend The total MB of all the LDEVs created in a specified RAID group for the given Host group over the entire data collection interval.
Table 40 Metrics and descriptions (continued) Metric category Metric Description ACP Random Read MB – Frontend The frontend throughput in MB/s read randomly from an ACP. ACP Random Write MB – Frontend The frontend throughput in MB/s written randomly to an ACP. ACP Total Sequential MB – Frontend The total frontend throughput in MB/s read from or written sequentially to an ACP. ACP Sequential Read MB – Frontend The frontend throughput in MB/s read sequentially from an ACP.
Table 40 Metrics and descriptions (continued) Metric category Metric Description Total Random MB – Frontend The sum total of random frontend I/Os throughput in MB/s transfer rate of all the virtual volumes in this pool. Total Random Read MB – Frontend The sum total of random frontend read I/Os throughput in MB/s transfer rate of all the virtual volumes in this pool.
Table 40 Metrics and descriptions (continued) Metric category Metric Description Total Sequential Write MB – The frontend throughput in Frontend MB/s data written sequentially to the external volume. Cache MB Metric Cache Usage MB The amount of cache used in MB. Cache Writes Pending MB The writes that are held in cache, yet to be transferred to the disks. Cache Sidefile Usage MB The size of the P9000 Continuous Access Asynchronous side file usage in MB.
Table 40 Metrics and descriptions (continued) Metric category Metric Description • ACP Left Util MP0 The utilization of the MP# on the left ACP. • ACP Left Util MP1 • ACP Left Util MP2 • ACP Left Util MP3 • ACP Left Util MP4 • ACP Left Util MP5 • ACP Left Util MP6 • ACP Left Util MP7 ACP Right Util Total The total utilization of the right ACP in the ACP pair. • ACP Right Util MP0 The utilization of the MP# on the right ACP.
Table 40 Metrics and descriptions (continued) Metric category Metric Description RAID Group Utilization Random Write Parity The utilization of the RAID group for writing random parity. RAID Group Utilization Seq Reads The utilization of the RAID group for sequential reads. RAID Group Utilization Seq Writes The utilization of the RAID group for sequential writes. RAID Group Utilization Seq Write Parity The utilization of the RAID group for writing sequential parity.
Table 40 Metrics and descriptions (continued) Metric category Metric Description MP Blade Util - Top 20 Consumers The average MP blade utilization by each of the 20 consumers over an entire collection interval. The top 20 consumers count is derived based on each consumer's average utilization of the CPU cycles. Used Capacity per Tier Used capacity of a pool tier over a collected monitoring cycles in a given duration.
Table 40 Metrics and descriptions (continued) Metric category Response Time Metrics Metric Description ACP Pair Write Tracks – Backend The total backend tracks destaged in sequential mode from the specified ACP Pair. ACP Pair Total Tracks – Backend The Overall backend transfers for the selected ACP pair. ThP Pool Backend Tracks Total backend tracks associated with a ThP pool. An aggregate of all the backend transfers as a result of I/Os occurring on every VVol in a ThP pool.
Table 40 Metrics and descriptions (continued) Metric category Metric Description the last 30 seconds of the collection interval. of all the LDEVS associated with the given host group. Average Read Response Time The average read response time of all the LDEVs created in a specified RAID group for the given Host group over the entire data collection interval.
Table 41 Real-time metrics definitions (continued) Real-time metrics Definitions Total KB per IO IO size Total random IOPS IO size Total random read hits IO size Total random read hit IOPS IO size Total random write IOPS IO size Total read IOPS IO size Total read KB per IO IO size for reads Total read through put KB per second IO size for reads Total seq IOPS IO size for reads Total seq read hits IO size for reads Total seq IOPS IO size for reads Total seq read IOPS IO size for read
Table 41 Real-time metrics definitions (continued) Real-time metrics Definitions Be - Total cache lines staged percentage Total backend reads percentage RG% Raid group utilization 406 Metric Category, metrics, and descriptions
F Appendix F Forecasting ThP pool performance Guidelines for selecting data range to receive an optimal forecast To validate the forecasted data, we need to understand the trend of the existing data, as the forecasted data is an extension of the existing trend. The forecasted data represents a trend of the ThP pool occupancy values and not the actual values. The following graph indicates the trend of the actual values. The forecasted values be an extension of the trend of the selected data points.
Glossary A Array Control Processor (ACP) ACP is used in the XP disk arrays prior to the XP24000 Disk Array. With the introduction of the XP24000 Disk Array, the DKA has replaced ACP. The DKA is also applicable for the P9000 disk arrays. ACP handles the transfer of data between the cache and the physical drives held in the DKUs. The ACPs work in pairs, providing a total of eight SCSI buses. Each SCSI bus associated with one ACP is paired with a SCSI bus on the other ACP pair element.
Command View (CV) Replaced by the Command View Advanced Edition Suite Software. Command View AE (CV AE) The Command View Advanced Edition Suite Software replaces the XP Command View Software to manage the XP and P9000 disk arrays. Consistency Group ID (CTG) A Group ID which guarantees consistency in the sequence of asynchronous data transfers for a remote copy volume group.
F FC Fibre Channel. A network technology primarily used for storage networks. G Globally unique identifier (GUID) It is a special type of identifier used in the software applications to provide a unique reference number. The value is represented as a 32 hexadecimal character string, such as the {21EC2020-3AEA-1069-A2DD-08002B30309D} and usually stored as a 128 bit integer.
P HP XP P9000 Performance Advisor The HP XP P9000 Performance Advisor is a software product from HP for monitoring the XP and the P9000 storage subsystems. Primary Volume (PVOL) The PVOL (also seen with a hyphen as P-VOL) is the first of a paired volume set for any program product other than those used for the remote copy operations. R RAID group A group of disks configured to provide enhanced redundancy, performance, or both.
T Thin Provisioning (ThP, TP) Using the thin provisioning, you can operate with a global pool of LDEVs that are not assigned to a physical storage. The XP and the P9000 disk arrays add virtual capacity from the pool of LDEVs as and when the data is written, and only at that time is the physical capacity assigned to the LDEVs and used for storage purpose.
Index Symbols C 10 busiest back-end RAID groups, 206 10 busiest front-end LDEVs, 205 Cache IO Metric, 399 Cache logical partitions (CLPRs), 358 Cache MB Metric, 399 changing database records, 89 Chart Style Line Plus Moving Average Chart Style, 286 Moving Average Chart Style, 285 Time Line Chart Style, 285 Time Line No Breaks Chart Style, 286 Charts Adding charts, 229 Favorite charts, 229 Saving charts, 229 Working with, 388 charts configuring metrics, 229 displaying data, 229 displaying different rates,
Chart Work Area High watermark, 103 LDEV Information Busiest LDEVs, 103 Statistics Frontend, Cache, Backend, 103 XP Array health Normal, Critical, Major, 103 Data Grid Update screen, 87 Database Archive data, 138 Backup utility, 138 Configure, 138 ExportDB, 138 Import data, 138 Purge, 138 database changing records, 89 configuring size, 141 purging, 142 Database Configuration Auto Grow, 140 Auto purging, 144 Database screen, 138 disk space requirements, 166 Displaying Authorized groups, 91 Authorized users,
P P9000 array serial number Capacity Meter based Term license, 15 P9500 disk array, 15 P9000 Command View AE Coexistence, 10 P9000 disk arrays Real-time monitoring Host agents, CMDs, 316 SVP registration Outband collection, 70 PA installation Instant-on Grace period, 15 Performance data Automatic updates, 60 Collecting, 56 creating, 60 Delete schedule, 66 Edit schedule, 66 RAID groups, ports, 60 Restart schedule, 66 viewing, 60 performance data displaying, 213 displaying charts, 229 purging, 142 Performance
Utilization Status DKA, MP, RAID group, Cache write pending, 331 utilization metrics, 399 V View/Generate Reports logging report details and exceptions, 309 W websites HP , 356 HP Subscriber's choice for business, 355 X XP array CLPR utilization, Cache, 181 XP array serial number Capacity Permanent, 15 XP disk array, P9000 disk array, 15 XP disk arrays Real-time monitoring Host agents, CMDs, 316 SVP registration Outband collection, 70 416 Index