
HP XP P9000 Performance Advisor Software v6.0 User Guide

NOTE: The LDEVs, journal groups, or the E-LUNs are referred as consumers on the Dashboard
screen.
By default, the consumers are sorted in a descending order and displayed in the Component
Information section. The consumers with quicker average read and write response time or a high
average MP blade utilization are displayed first, followed by those with higher response time and
low average utilization values.
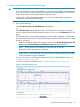
You can specify the number of consumers that must be displayed in the Component Information
section of the Dashboard screen. The maximum acceptable number is 50 and the minimum
acceptable number is 0. By default, 20 consumers are displayed at a time in the Component
Information section when you click a port, RAID group, or an MP blade in the Statistics section. If
there are less than 20 consumers, all of them are displayed in the Component Information section.
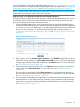
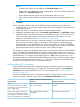
To specify the consumer settings:
1. Go to the Component Settings section on the Threshold Setting screen.
2. From the Maximum Components list, select the maximum number of consumers you want to
view in the Component Information section of the Dashboard screen.
3. Select Ascending or Descending as the Sort by Average Response Time.
4. Click Save to update the consumer settings.
The maximum X busiest consumers appear in the Component Information section on the Dashboard
screen. For more information, see “Dashboard busiest consumers” (page 110).
Related Topics
• “Dashboard threshold metrics” (page 100)
• “Viewing dashboard” (page 103)
• “Dashboard charts” (page 111)
• “High watermark in dashboard charts” (page 112)
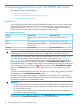
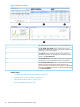
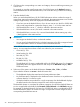
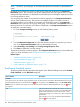
Dashboard threshold metrics
The following table describes the metrics that appear on the Threshold Setting screen in the Frontend,
Cache, Backend, and the MP Blade categories.
DescriptionScreen elements
Frontend
If any of the ports or the CHA MPs usage (applicable only for the XP disk arrays) exceeds the defined threshold limit during the
specified threshold duration for a frontend metric, the status icon appears in the Frontend category in the XP/P9000 Array
Health section. For example, if the usage of a port for the IOPS metric exceeds the defined threshold even once, the status
icon appears.
The IOPS threshold value indicates the average I/Os that you
define an individual port can handle over a specified duration.
IOPS
HP XP P9000 Performance Advisor uses this value to verify
whether the average I/Os on each port is within or beyond the
set threshold.
If the average I/Os on a port exceeds the defined threshold
limit, the status icon appears.
100 Monitoring performance of XP and P9000 disk arrays