
HP XP P9000 Performance Advisor Software v6.0 User Guide

HP XP P9000 Performance Advisor considers the following factors to arrive at the average usage
data for a component in the Frontend, Cache, Backend, and the MP Blade categories:
• Threshold limits set for metrics in the Frontend, Cache, Backend, or the MP Blade category
• Threshold duration (6 hours, 12 hours, or 24 hours)
After the threshold limits are defined for the categories and the corresponding metrics on the
Threshold Setting screen, HP XP P9000 Performance Advisor does the following for the XP or the
P9000 disk arrays:
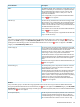
1. Monitors the usage of every component in the XP or the P9000 disk array and retrieves the
appropriate values. It is based on the categories and the corresponding metrics for which the
threshold limits are defined:
• The average overall I/Os and MB/s on individual ports
• The average overall utilization of MPs that belong to a CHA
• The cache usage (%) and writes pending (%)
• The average sequential backend read tracks on individual RAID groups
• The average non-sequential backend read tracks (also known as random backend reads)
on individual RAID groups
• The average sequential backend write tracks on individual RAID groups
• The average utilization of a RAID group
• The average utilization of an ACP/DKA pair
• The average utilization of an MP blade
IMPORTANT:
• The average CHA MPs and the DKA MPs utilization metrics are applicable only for the
XP disk arrays.
• The average MP blade utilization metrics is applicable only for the P9000 disk arrays.
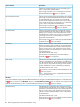
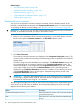
2. During the specified threshold duration, if the usage of any component crosses the defined
threshold limit for any metric in a particular category, the appropriate status icons appear in
the Frontend, Cache, Backend, or the MP Blade category in the XP/P9000 Array Health section
and beside the respective components in the Statistics section. The average usage summary
of individual components is also displayed in the Statistics section.
If the threshold limit is defined for at least one metric in a particular category, the respective Statistics
section displays the average usage data of components for all the metrics in that category. However,
the overall usage status of an XP or a P9000 disk array in that category is based on the usage of
components for only those metrics whose threshold limits are configured on the Threshold Setting
screen.
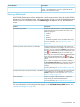
For example, assume that the threshold limit is set only for the RG Seq Reads (IOPS) (Avg Seq
Reads) metric in the Backend category. So, the status icon displayed in the XP/P9000 Array Health
section in the Backend category is based on whether the usage data of individual components for
RG Seq Reads (IOPS) (Avg Seq Reads) metric is within or beyond the set threshold limit. However,
when you click the status icon in the Backend category, the average usage data of components
displayed in the Statistics section includes data for the following backend metrics in addition to
the RG Seq Reads (IOPS) (Avg Seq Reads) metric:
• RG NonSeq Reads (IOPS) (Avg NonSeq Reads)
• RG Writes (IOPS) (Avg Writes)
• RG Util (%)
• Avg DKA Pair Util (%)
106 Monitoring performance of XP and P9000 disk arrays