
HP XP P9000 Performance Advisor Software v6.0 User Guide

In every data collection cycle, HP XP P9000 Performance Advisor retrieves and compares the
current performance value of a component with the set threshold value. The time when this value
was retrieved and compared is shown under Time Updated. If the current performance value
exceeds the set threshold value, HP XP P9000 Performance Advisor does the following:
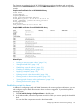
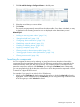
1. Posts a new record and displays the time of posting under Time Posted
2. Dispatches an alarm notification of type, P9000 Alarm to the intended recipient
3. Displays the time of dispatch under Time Dispatched
4. Monitors the component till its performance value drops below the set threshold value
5. Updates the time of monitoring under Time Updated
IMPORTANT: The time shown under Time Updated is in sync with the data collection cycle
frequency.
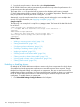
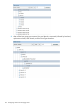
If the performance value of a component drops below the set threshold value, HP XP P9000
Performance Advisor does the following:
1. Posts a new record and displays the time of posting under Time Posted
2. Dispatches an alarm notification of type, P9000 Alarm – Good Information alarm to the
intended recipient
3. Displays the time of dispatch under Time Dispatched
4. Monitors the component continuously to verify whether its performance is within or beyond
the set threshold level
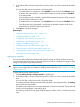
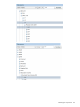
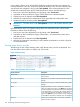
Viewing alarm history records
The following are the column headings under which alarms history records are displayed. At a
time, the Alarms History table can display only 100 records:
Figure 9 Alarm History
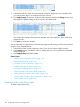
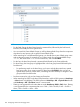
Table 7 Viewing alarm History records
DescriptionScreen elements
Displays the current state of an alarm: Recovery Alarm or
Serious Alarm.
Alarm State
Displays the array model to which the selected component
belongs.
DKC/Grp (Array Name)
Displays the array type to which the selected array model
belongs.
Array Type
Displays the metric for which a component is monitored.
When you select the All option in the Metrics list, the alarm
Metric
records configured on the selected component are displayed
in the Alarms table. If you select an XP or P9000 disk array
in the component selection tree and then choose the All
option in the Metrics list, the list of alarm records configured
on the different components in that disk array are displayed.
Displays the component that is monitored for a particular
metric and metric category.
Resource
130 Configuring alarms and managing events