
HP XP P9000 Performance Advisor Software v6.0 User Guide
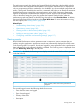

Filtering records in Alarms History table
To filter alarm history records based on Alarm History filters:
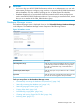
1. Click Monitoring+Alarm History in the left pane.
The Alarms History screen appears.
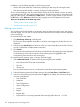
2. Filter and view component records based on the following options. For description on each
of the filters, see “Alarm History filters” (page 132):
• Metric list: Displays the metrics for which components are selected and alarms configured
on them.
If you have used the first level of filters, the Metric list displays only those metrics for which
alarms are created on the selected components.
In addition, the All option lists all the alarms history records that are created on the
different components in the selected XP or P9000 disk array.
• Error Status list: Displays the type of errors generated when alarm notifications are not
triggered.
• Alarm Type list: Displays the type of alarms that are generated, Serious Alarm and
Recovery Alarm.
• Array list: Displays the disk arrays for which alarms are generated.
• Time Stamp list: Displays the time stamps for records posted, updated, and notifications
dispatched.
• Start Time, End Time: Start and end time for the selected time stamp.
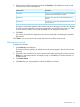
3. Click Filter. HP XP P9000 Performance Advisor filters the existing set of records and displays
only those that match the selection criteria on the Alarm History screen. The records are
displayed in an ascending order. For more information on Alarms History screen, see “Alarm
History screen” (page 130).
Click Clear Filter any time while selecting values from the filter options. It removes the current
selection and display all the records in the Alarms History table.
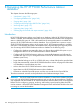
Alarm History filters
The following table describes the Alarm History filters.
DescriptionScreen elements
Displays the metrics for which components are selected
and alarms configured on them.
Metric list
In addition, the All option lists all the alarms history records
that are created on the different components in the selected
XP or P9000 disk array.
Displays the following error types:Error Status list
• Email errors
• SNMP errors
• Script errors
• All errors
• No errors
Select one of the above-mentioned error types to filter
records and view the status of the respective alarm and
SNMP notifications, and script executions. If you select
Email errors, SNMP errors, Script errors, or All errors, HP
XP P9000 Performance Advisor returns anything that is
non-zero for these selections. If you select No errors, HP
132 Configuring alarms and managing events