
HP XP P9000 Performance Advisor Software v6.0 User Guide
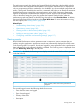

DescriptionScreen elements
XP P9000 Performance Advisor displays only zero items,
that is the alarms that were successfully dispatched.
Displays the disk arrays for which alarms are generated.Arrays list
This list displays the following options:Time Stamp list
• Time posted (default selection): If this option is selected,
the time stamps of when the records are posted on the
Alarm History screen are displayed. A record for a
component is first posted on the Alarm History screen
when the following conditions are met:
◦ Alarm is enabled on the component.
◦ Performance data collection is in progress.
HP XP P9000 Performance Advisor pings the component
in the next data collection cycle to receive its current
performance value, and also posts a new record on the
Alarm History screen. HP XP P9000 Performance
Advisor again posts a new record for the same
component and displays the new time of posting under
Time Posted when one of the following conditions is
met:
◦ The alarm is disabled or there are no I/Os
transactions on the component.
◦ The performance of a component rises or drops
below the set threshold level.
• Time updated: If this option is selected, the time stamps
when HP XP P9000 Performance Advisor last collected
the latest performance values for all the components are
displayed.
• Time dispatched: If this option is selected, the time
stamps when HP XP P9000 Performance Advisor
dispatched the alarm notifications are displayed.
If a record is showing a blank entry for any of these time
stamps, that particular record is skipped during the filtering
phase. Assuming that the I/Os transactions are not
happening on a particular component, and the alarm is
also disabled. In such a case, the Time Updated displays
a blank entry for that component record. Hence, the record
is skipped when you filter based on Time Updated option.
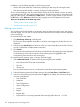
This list displays the following options:Alarm Type
• All: This option is for viewing both the serious and the
recovery alarms.
• Recovery Alarm: This option is for viewing records that
are logged for alarm notifications dispatched after the
performance of a component dropped below the set
threshold limit.
• Serious Alarm: This option is for viewing records that
are logged for alarm notifications dispatched when the
performance of a component rises beyond the set
threshold limit. An alarm notification is dispatched only
the first time when the performance of a component
goes beyond the set threshold limits.
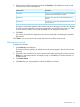
Select the start and end time range for filtering the
component records, from the respective calendars.
Start Time, End Time boxes
Managing alarms history 133