
HP XP P9000 Performance Advisor Software v6.0 User Guide
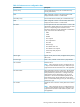
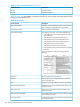
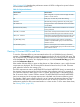
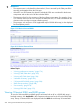
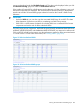
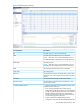
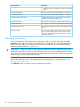

Table 19 (page 205) describes the performance metrics of LDEVs configured as journal volumes
and associated with the P-VOL:
Table 19 CA journal volumes
Column HeadColumn Head
LDEV configured as a journal volume. Displays the LDEV
number in cu:ldev format.
LDEV ID
RAID group to which the journal LDEVs belong.RG
MP blade ID processing requests for the journal group.MP Blade
Average utilization of the MP blades that are associated
with the LDEVs.
MP Utilization %
Total number of backend tracks transferred to or from the
XP array backend.
Backend Transfer (Tracks)
Total random and sequential frontend read and write MBs
on the journal LDEV during the entire collection interval.
LDEV MB/s - Frontend
Total random and sequential frontend read and write I/Oss
on the journal LDEV during the entire collection interval.
LDEV I/Os - Frontend
Average read response time of all the journal LDEVs
created in a specified RAID group over the entire data
collection interval.
Avg Read Resp (msec)
Maximum read response time of all the journal LDEVs
created in a specified RAID group over the last 30 seconds
of the collection interval.
Max Read Resp (msec)
Viewing 10 busiest LDEVs and Ports
To view the 10 busiest LDEVs or ports associated with an XP or a P9000 disk array's frontend
activities, click FrontEndIO in the component selection tree for the XP or the P9000 disk array. The
top 10 busiest LDEVs are displayed under the LDEV tab and the top 10 busiest ports are displayed
under the Ports tab. This data is also displayed when you click the Frontend Total Avg group box
under the Performance View tab.
If the number of busiest LDEVs or ports are less than ten or if their utilization is zero, only the busiest
components are displayed. The 10 busiest LDEVs selected is based on the I/Os and 10 busiest
ports selected is based on the average I/Os.
The LDEV response time metrics, MAX READ RESP and MAX WRITE RESP (msec) are measured as
the maximum response time over the last 30 secondss of the collection interval. For example, if
your collection interval for RAID group is set to 5 minutes, the MAX value is calculated over the
last 30 seconds of the 5 minute collection interval. The AVG READ RESP and AVG WRITE RESP
(msec) are measured as the average response time calculated over the entire collection period.
For example, if RAID group collection interval is set to 5 minutes, the Average Response Time is
calculated over the entire 5 minutes collection period. Click an LDEV ID or port ID to view the
performance graphs for all the associated metrics in a chart window. To know more about charts,
see “Plotting charts” (page 233).
Viewing 10 busiest LDEVs and Ports 205