
HP XP P9000 Performance Advisor Software v6.0 User Guide

Related Topics
• “Viewing performance summary” (page 174)
• “Viewing CHIP/CHA data” (page 182)
• “Viewing ACP/DKA data” (page 186)
• “Utilization Summary” (page 180)
• “10 busiest LDEVs/Ports” (page 205)
• “RAID Group summary” (page 208)
• “Port summary” (page 210)
• “Viewing LDEV data” (page 213)
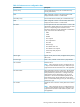
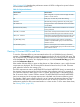
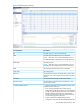
Viewing RAID group summary
To view the summary of overall utilization of RAID groups for an XP or a P9000 disk array, click
RG Summary in the component selection tree for that XP or P9000 disk array. This feature totals
the LDEV I/Os, LDEV MB/s, cache fast write, disk fast write, cache bypass, and backend transfer
values for all the LDEVs on a given RAID group. In addition, it also displays the percentage of the
RAID Group utilization random read, random write, random write parity, sequential read, sequential
write, sequential write parity, and the overall RAID group percentage utilization (sum of the above
percentages) on a given RAID group.
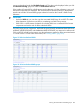
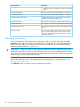
IMPORTANT:
• The RAID group utilization percentage is not displayed for external storage volumes.
• The Auto LUN XP software must be installed, and monitoring must be enabled on the
XP1024/XP128 Disk Array for the RAID group utilization metric to be available on these
arrays.
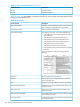
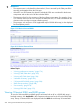
Click a RAID group ID to view the associated performance graphs in the Chart Work Area. In
addition, view the associated details, such as the RAID level, ACP pair, drive type, and RPM rate.
For more information, see “Plotting charts” (page 233).
Click Refresh when you want to view the updated RAID group summary.
208 Viewing XP and P9000 disk array components