
HP XP P9000 Performance Advisor Software v6.0 User Guide


DescriptionSections
◦ Snapshot Pool
◦ Pools
◦ Replication Volumes
◦ LUSE
◦ Host Groups
◦ Ext-RG(s)
◦ Drive Types
In addition to the above listed, the MP Blades category is also displayed for the P9000 disk arrays.
• Custom groups
The custom groups that you created appear. When you click a custom group, all the LDEVs that belong
to the custom group are displayed for your selection. For more information on creating custom groups,
see “Creating custom groups” (page 82).
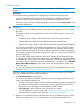
Click the + sign for any of the above-mentioned categories to view the associated component types and
individual components. The component types can further expand to display the corresponding individual
components. For example, when you click the + sign for Front-end, it expands to display the Ports
component type that provides the list of individual ports on the selected XP or the P9000 disk array. For
more information on selecting components from the XP and the P9000 disk arrays, or custom groups, see
“Selecting components and metrics” (page 235).
The Configuration data collection for the XP and the P9000 disk arrays must be complete for the component
selection tree to appear under Data Source.
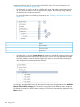
Includes the Available Metrics Choose Metric Category list that displays all the applicable metrics from
the following metric categories for a selected component:
• Frontend IO Metrics
• Frontend MB Metrics
• Utilization Metrics
• Backend Metrics
• Response Time Metrics
Select components from the component selection tree and metrics from the Available Metrics Choose Metric
Category list to view their performance graphs in the Chart Work Area. By default, the most used metric
category and related category metrics are listed. For more information, see “Choosing metrics” (page 237).
The Chart Settings section displays settings that you can apply on the selected charts. You can do the
following using the chart settings:
Chart Settings
• View performance graphs of components for a duration of your choice.
• Forecast the DKA, MP, cache write pending, RAID group, and ThP pool utilization for an XP disk array.
Forecast the MP blade, cache write pending, RAID group, and ThP pool utilization for a P9000 disk
array.
• View the last 10 performance data points for components.
• View graphs using the different chart styles.
• View or hide the legends, zoom preview panel, and the data points.
• View the LDEVs that are currently assigned to MP blades.
• Align the chart windows either vertically or horizontally in the Chart Work Area.
For more information, see “Using chart controls and settings” (page 276).
Charts screen 231