
HP XP P9000 Performance Advisor Software v6.0 User Guide


component selection tree, if you are aware of the LDEV name. For more information, see
“Searching for components” (page 265):
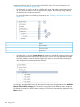
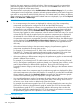
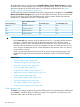
• Click the plus (+) sign for an XP or a P9000 disk array and select components from the
list, for which you want to view the performance graphs. The following image displays
the hierarchy for component selection.
For more information on selecting components, see “Selecting components and metrics”
(page 235).
Node1
Main category2
Component type3
Component4
• Click the plus (+) sign for Custom Groups and select an individual custom group from the
list followed by the associated LDEVs for which you want to view the performance graphs.
The DKC numbers of the XP and the P9000 disk arrays to which the LDEVs belong are
also displayed in brackets beside the LDEV IDs.
Accordingly, the applicable metrics for the selected components are populated in the Available
Metrics Choose Metric Category list. The metrics are grouped under different metric categories.
By default, the metrics for the first metric category in the list are automatically displayed in the
Metric column.
234 Using charts