
HP XP P9000 Performance Advisor Software v6.0 User Guide


For P9000 disk arraysFor XP disk arraysDescriptionReport types
and ranges from 8 - 128 for
the frontend and the backend
LDEVs, and 8 - 32 for the
frontend and the backend RAID
groups.
For more information, see
“Creating a report for the
busiest LDEVs and RAID
groups” (page 302).
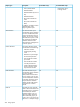
YesYesThe LDEV Activity report
provides data on the average
LDEV Activity
performance and the utilization
of LDEVs. The following are the
different metrics available for
the LDEV Activity report:
• FrontEndIO
• BackEnd IO
• MB
• Utilization
• Read Response Time
• Write Response Time
The LDEV data corresponding
to each of the above metric is
provided in a separate .csv
file, based on the metric that
you select. For more
information, see “Creating an
LDEV Activity report”
(page 303).
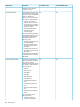
YesYesThe RAID Group Utilization
report provides the top 32
RAID Group Utilization
RAID groups, which is derived
based on the extent of
utilization of each RAID group.
It is available as standalone
report and also as a part of the
All report. For more
information, see “Creating
report to view the most utilized
RAID Groups” (page 304).
YesYesThe Journal Pool Utilization
report provides data on the
Journal Pool Utilization
utilization percentage of the
eight busiest Journal groups.
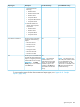
YesYes (only for the XP24000 Disk
Array)
The ThP Pool Occupancy report
provides data on the utilization
ThP Pool Occupancy
percentage of the eight busiest
ThP pools. HP XP P9000
Performance Advisor reports
only those ThP volumes that are
assigned to a pool.
YesYes (only for the XP10000 and
later array types)
The Snapshot Pool Occupancy
report provides data on the
Snapshot Pool Occupancy
utilization percentage of the
eight busiest snapshot pools.
HP XP P9000 Performance
Advisor reports only those
Types of reports 293