
HP XP P9000 Performance Advisor Software v6.0 User Guide


IMPORTANT:
• Reports on the following are available only if they are configured in the selected XP or P9000
disk array. If not configured, they are not even displayed as options to select for create their
reports. In addition, they are also not displayed in other related reports, like the Array
Performance and the All reports.
◦ Journal Pool Utilization
◦ ThP Pool Occupancy
◦ Snapshot Pool Occupancy
• In the report that you create, HP XP P9000 Performance Advisor plots the data for a maximum
of eight components in each chart that is displayed in the report. For example, if you want to
view the LDEV IO report for the 64 busiest LDEVs, HP XP P9000 Performance Advisor provides
a single report that includes eight charts. Each chart accommodates data for a maximum of
eight LDEVs.
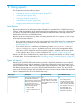
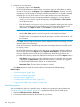
Create/Schedule Reports screen
The Create/Schedule Reports screen appears by default when you click Reports in the left pane.
Figure 31 Reports screen
To generate, save, or schedule reports, click Reports+Create/Schedule Reports in the left pane.
For more information, see “Generating, saving, or scheduling reports” (page 297).
To view the following, click Reports+View Reports in the left pane:
• Records for the reports that you schedule periodically or save in HP XP P9000 Performance
Advisor
• Schedules that are to be executed more than once
296 Using reports