
HP XP P9000 Performance Advisor Software v6.0 User Guide
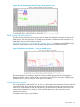
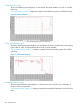
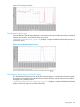
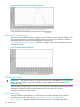
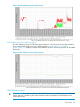
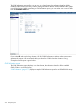
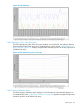
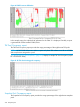
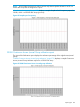
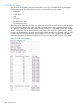

Figure 48 Total Frontend I/O Rate First Top 8 Array Groups/Pools
RAID Group Utilization Report
The Raid Group Utilization report consists of four charts that display the utilization of the top 32
RAID groups, split into eight each. The RAID group utilization indicates the total utilization of a
RAID group over an entire collection interval.
“RAID Group Utilization — First top 8 RAID groups” (page 371) displays a sample RAID Group
Utilization report that provides the first top eight RAID groups for a P9500 Disk Array.
Figure 49 RAID Group Utilization — First top 8 RAID groups
The report displays the utilization graphs for only those RAID groups that have managed the
backend transfers. When a RAID group is associated with a ThP pool, the extent of RAID group
utilization due to I/Os occurring on a ThP pool is considered.
Cache utilization report
The cache utilization reports allow you to view in a chart format, the utilization of cache in the XP
or the P9000 disk array, the amount of data in the cache that is waiting to be written to a disk,
read hits as a percentage of total read operations, the total number of transfers per second, the
total number of transfers over 24-hour, cache side file utilization for the continuous access
asynchronous activity.
A sample of each report is given below:
Report types 371