
HP XP P9000 Performance Advisor Software v6.0 User Guide

6 Monitoring performance of XP and P9000 disk arrays
This chapter discusses the following topics:
• “Introduction” (page 94)
• “Configuring dashboard threshold settings” (page 97)
• “Viewing dashboard” (page 103)
Introduction
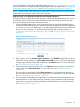
HP XP P9000 Performance Advisor provides a dashboard, where you can view the overall usage
status of the XP and the P9000 disk arrays. The overall usage status is based on the usage of
individual components. “Dashboard categories” (page 94) lists the categories for an XP and a
P9000 disk array and the components that are grouped in each category:
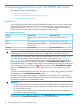
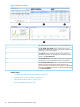
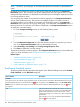
Table 6 Dashboard categories
P9000 disk arraysXP disk arraysCategory
The ports and the installed CHAsThe ports and the installed CHIP/CHA
MPs
Frontend
The cache memory and the CLPRsThe cache memory and the CLPRsCache
The RAID groups and the installed DKAsThe RAID groups and the installed
ACP/DKA MPs
Backend
The installed MP bladesNot applicableMP Blade
IMPORTANT: Since, the CHIP/CHA and the ACP/DKA MPs are moved to the MP blades in the
P9000 disk arrays, their MP utilization metrics are not applicable for the P9000 disk arrays.
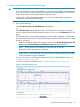
The usage data of components is retrieved for a threshold duration of 6 hours, 12 hours, or 24
hours, and for those metrics whose threshold limits are set in the categories (see “Dashboard
categories” (page 94) on the Threshold Setting screen. Based on their usage, the appropriate
status icons are displayed in the respective categories in the XP/P9000 Array Health section of
the Dashboard screen. For example, if the usage of even one RAID group crosses the set threshold
limit at least once in the last 12 hours, the status icon appears in the XP/P9000 Array Health
section in the Backend category and indicates critical use of one or more RAID groups in that
category.
If you have not set the threshold limit for even one metric in a category, the status icon appears
in that category in the XP/P9000 Array Health section.
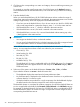
In addition, the average usage summary for components is also derived from the set threshold
duration and verified against the threshold limits set for metrics in the particular category. Thereafter,
the statistics are displayed on the Dashboard screen.
IMPORTANT:
• The threshold duration is the period during which HP XP P9000 Performance Advisor monitors
the point in time and average usage of components, and determines the overall health of the
XP or the P9000 disk array.
• The average usage of components is monitored for those categories where threshold limits
are set for the corresponding metrics.
You can plot the usage graphs for components in the Chart Work Area and view the X busiest
components in the Component Information section of the Dashboard screen.
94 Monitoring performance of XP and P9000 disk arrays