
HP XP P9000 Performance Advisor Software v6.0 User Guide

NOTE:
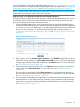
• By default, the duration is set to 6 hrs in the Threshold Setting screen.
• All the charts in the dashboard screen is displayed for 1 hour if the duration selected is
current in the Threshold Setting screen.
• Ensure that both the host agents and the management station is in sync.
• Ensure that the system clock time on both the host agents and management station is in
sync.
5. Click Save.
For the selected threshold duration, HP XP P9000 Performance Advisor does the following:
1. Collects the point in time and the average usage values of the individual components for the
corresponding metrics.
2. Verifies the values for a component with the respective threshold values.
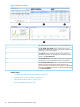
3. Displays the appropriate status icons in the Frontend, Cache, Backend, or the MP Blade category
(applicable only for the P9000 disk arrays) on the Dashboard screen. Click a status icon to
view the average usage summary of individual components in that category. For more
information on Dashboard, see “Viewing dashboard” (page 103).
If the threshold limits are not set for a particular category, HP XP P9000 Performance Advisor
does not verify the usage summary of components in that category and displays the
(Disabled) status icon on the Dashboard screen for that category. To view the overall usage
status of the XP and the P9000 disk arrays, and the average usage summary of components,
specify the threshold limit for at least one metric in the respective category.
The changes you make on the Threshold Setting screen are immediately reflected on the Dashboard
screen. By default, HP XP P9000 Performance Advisor retrieves data for the past six hours from
the time you saved the threshold settings. It considers the management station time to calculate the
threshold duration. For example, if the threshold duration is 6 hrs and the current time on your
management station is 5:00 PM, HP XP P9000 Performance Advisor considers the usage summary
of components for the past six hours (11:00 a.m. – 5:00 p.m) to display the overall usage status
for the XP or the P9000 disk array on the Dashboard screen.
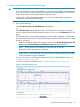
Specifying the top 20 consumers
HP XP P9000 Performance Advisor displays the maximum X busiest consumers or components
(default 20) for a port, RAID group, or an MP blade. This data is displayed in the Component
Information section of the Dashboard screen. For more information, see “Dashboard busiest
consumers” (page 110).
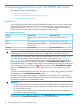
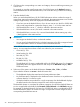
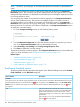
The following table lists the types of consumers, the factors considered to arrive at the maximum
X busiest consumers, and their sorting order in the Components Information section.
Sorting of consumers
Maximum and least X busiest consumers
based onConsumer type
The average read and write response time
of LDEVs
The average read and write response time
values are considered
LDEVs
A consumer can belong to the LDEVs
consumer type if it is associated with a
port or a RAID group
The average MP blade utilizationThe average MP blade utilization is
considered
LDEVs, journal groups, or the E-LUNs
A consumer can belong to the LDEVs,
journal groups, or the E-LUNs consumer
type if it is associated with an MP blade
Configuring dashboard threshold settings 99