
HP XP P9000Watch and HP XP P9000Sketch Reference Guide for HP XP P9000 Performance Advisor v5.5 (T1789-96341, February 2013)


Time of the samples displayed in the Graph Area. The Status bar displays the location of the CSV
file.
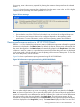
Figure 27 shows multiple graphs plotted for multiple metric selection.
Figure 27 Multiple graphs plotted for multiple metric selection
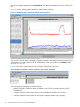
You can also view the Metrics Available, Samples Available, and Samples Displayed data for the
CSV file that is currently loaded in HP XP P9000Sketch. Point to a location on the Metrics label,
as shown in Figure 28.
Figure 28 shows the available metrics and samples displayed on the screen.
Figure 28 Metric available, samples available, and samples displayed
A tool tip appears displaying the following data:
• Metrics Available: number of metrics available in the CSV file currently loaded in HP XP
P9000Sketch
• Samples Available: total number of data points (samples) available in the CSV file
• Samples Displayed: total number of data points (samples) plotted on the graph(s)
60 Viewing performance metrics in HP XP P9000Sketch