
XPWatch and XPSketch Reference guide for HP XP P9000 Performance Advisor
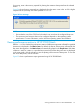
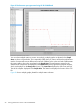
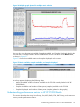

Figure 25 Performance report generated using HP XP P9000Sketch
You can select multiple metrics at a time. Accordingly, multiple graphs are plotted in the Graph
Area, as shown in figure below. This is especially useful when you want to analyze the performance
metrics of components across different time intervals. Different color codes are used to differentiate
the various metrics when they are plotted in the Graph Area. The performance metrics for the
selected set of components are displayed on the Domain Axis (X-axis) against the specified durations,
which are displayed on the Range Axis (Y-axis). The Lower Pane displays the Start Time and End
Time of the samples displayed in the Graph Area. The Status bar displays the location of the CSV
file.
Figure 26 shows multiple graphs plotted for multiple metric selection.
58 Viewing performance metrics in HP XP P9000Sketch