
XPWatch and XPSketch Reference guide for HP XP P9000 Performance Advisor
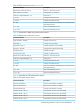
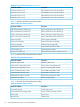

Table 30 CPU performance metrics (continued)
DescriptionPerformance Metrics
CHA PCB Busy Time for CPU 4(if installed)Utilization for MP 4 0[1/s]
CHA PCB Busy Time for CPU 5(if installed)Utilization for MP 5 0[1/s]
CHA PCB Busy Time for CPU 6(if installed)Utilization for MP 6 0[1/s]
CHA PCB Busy Time for CPU 7(if installed)Utilization for MP 7 0[1/s]
Table 31 describes the DKC performance metrics.
Table 31 DKC performance metrics
DescriptionPerformance Metrics
CHA to shared memory bus utilization [%]CHA to shared memory utilization [%]
DKA to shared memory bus utilization [%]DKA to shared memory utilization [%]
CHA to cache memory Xbar utilization [%]CHA to cache memory utilization [%]
DKA to cache memory Xbar utilization [%]DKA to cache memory utilization [%]
Cache usage for CLPR0 [MB]Cache usage [MB]
Write cache usage for CLPR0 [MB]Write cache usage [MB]
Side File usage for CLPR0 [MB]Side File usage [MB]
Cache random read hits for CLPR0Cache random read hits
Cache utilization for CLPR0Cache utilization [%]
Write cache utilization [%] for CLPR0, max=70%Write cache utilization [%]
Table 32 describes the CLPR performance metrics.
Table 32 CLPR performance metrics
DescriptionPerformance Metrics
CLPR Size [MB] for CLPRCLPR Size [MB] for CLPR
Cache memory usage [MB] for CLPRCache memory usage [MB] for CLPR
Cache write pending [MB] for CLPRCache write pending [MB] for CLPR
Cache sidefile usage [MB] for CLPRCache sidefile usage [MB] for CLPR
Cache Random read hits for CLPRCache Random read hits for CLPR
Cache memory usage [%] for CLPRCache memory usage [%] for CLPR
Cache write pending [%]Cache write pending [%]
Table 33 describes the CLPR performance metrics.
Table 33 JNL performance metrics
DescriptionPerformance Metrics
Journal State for JID#Journal State for JID#
Journal Utilization Percentage [%] JID#Journal Utilization Percentage [%] JID#
Q-Count JID#Q-Count JID#
Q-Marker JID#Q-Marker JID#
62 Viewing performance metrics in HP XP P9000Sketch