HP Insight Management Agents User Guide Part number: 308447-006 Sixth edition: March 2010
Legal notices © Copyright 2010 Hewlett-Packard Development Company, L.P. The information contained herein is subject to change without notice. The only warranties for HP products and services are set forth in the express warranty statements accompanying such products and services. Nothing herein should be construed as constituting an additional warranty. HP shall not be liable for technical or editorial errors or omissions contained herein. Confidential computer software.
Contents 1 HP Insight Management Agents for Servers…………………………………………………………………………5 Browser requirements ............................................................................................................................... 5 Java Virtual Machine requirements ........................................................................................................ 5 Updating Netscape Communicator for Tru64 UNIX workstations ....................................................................
3 Subsystem specific to a NetWare operating system………………………………………………………………80 Operating system overview ..................................................................................................................... 80 Summary page ...................................................................................................................................... 80 File System page.........................................................................................................................
1 HP Insight Management Agents for Servers The HP System Management Homepage version 8.25 and later acts as the Web server for the Management Agents. For additional information, see the System Management Homepage Online Help. Browser requirements The minimum browser requirements include support for tables, frames, Java™, JavaScript, and Java Development Kit (JDK) 1.1.
Obtaining JVM from HP.com Java support for Internet Explorer can be downloaded from http://www.hp.com/servers/manage/jvm, which provides options to download different versions of JVM from the Sun Microsystems website. Obtaining JVM from Sun Java support can be downloaded from Sun for both Microsoft Internet Explorer and Netscape Navigator from the Sun website at http://java.sun.com.
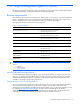
Security The HP Insight Management Agents allow SNMP sets for some system parameters. This capability requires security that includes the three predefined users. Agents running on Microsoft and Linux operating systems have no default passwords. On a fresh install the administrator password, operator password, and user passwords are configured during installation. For agents running on other operating systems, the default passwords are defined in Table 1-2.
• The WEBAGENT.INI file is located in the directory /var/opt/CPQIMddd/web/im/webagent if the pathname is /var/opt/CPQIMddd/bin/cpqthresh_mib, where the value ddd indicates the version of the Management Agents installed on the system. The Web Agent service must be stopped and restarted for any changes to take effect for Tru64 UNIX operating systems. Deploying the configurations to servers running Linux The configuration settings for the Management HTTP Server are stored in three files.
administrators if the file system enables it. For private key security reasons, HP recommends that the Management HTTP Server be installed on Windows NT® file systems (NTFS). NOTE: For Microsoft Windows operating systems, the \compaq\wbem subdirectory must exist on an NTFS file system for the private key to have administrator-only access through the file. If the private key has been compromised, the administrator can delete the \compaq\wbem\cert.pem file and restart the server.
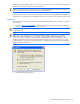
NOTE: If you have enabled anonymous access, then you can access the System Management Homepage displays without asking for any credentials locally. 3. Enter the user name and password. If the login fails, specify the domain and user name username in the User Name field (domain name\username). 4. Click Sign In. The System Management Homepage appears. NOTE: For the Version Control Repository Manager, the anonymous login (if enabled) and the user login enable you to access all pages.
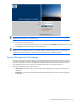
Header frame The header frame is always visible regardless of which tab you are viewing. A link, located in the top section, displays the path you are currently viewing along with the System Management Homepage tabs.
Host Name Displays full computer name of the system. System model The System Model displays the model of the device. In some cases, the System Model might display “Unknown” if the HP Insight Management Agents are not installed on the device. Management Processor – Integrated Lights Out Provides access to the HP Integrated Lights Out page associated with the system. Data Source Indicates which agents are populating data to the System Management Homepage.
Refresh Click on the Refresh link to refresh the System Management Homepage. . Body frame The body of the window displays the status for all HP management system details. System Management Homepage tabs The System Management Homepage displays up to five tabbed pages that enable you to access and configure settings related to participating HP web-enabled System Management software.
System Status The System Status displays a status icon with a label under it. A specific webapp sets the value of the System Status icon by using a predefined heuristic to signal the system status. If no webapp sets the System Status, then the worst of all the statuses in the Overall Status Summary box is displayed.
• File system space used • Logical Disks • Processors • Server • Memory • Network • Physical Disks • Processes • Processor Utilization Storage The Storage window displays the storage related information, this lists out the controller depending on the type of controller connected which may be any of the following types: • IDE Controllers • Drive array controllers • External Array Storage Systems • Fibre channel tape controller • SCSI controllers • SAS Host Bus Adapters System Co
SNMP Webagent The HP Management Agents page is used to view and set the HP Management Agents configuration. It allows settings for Server Role, Data Collection Interval, SNMP Sets and Remote Reboot settings. If you make Management Agents Configuration changes, you must click the Restart Agents button for changes to the HP Management Agents (Server Agents, Foundation Agents, Storage Agents, and NIC Agents) settings to take effect on the server.
Management HTTP Server section The Management HTTP Server section provides links allowing you to configure your Management HTTP Server settings.
Certificate selected, and leave the list of trusted systems empty by not importing certificates. HP strongly recommends using Trust by Certificate. • Trust by Name—Sets HP SMH to accept configuration changes only from servers with HP SIM names designated in the Trust By Name field. For example, you might use this option if you have a secure network with two groups of administrators in two divisions. It prevents one group from installing software to the wrong system.
Logs tab The Logs tab includes various log information like Integrated Management Log, HP Version Control Agent Log, Integrated Lights-Out Log, and System Management Homepage Log. Any logs contained in the installed HP Web-Enabled System Management software can be displayed on this tab. For example, if the Version Control Agent is installed, a link to the Version Control Agent log is displayed on the Logs page. You can access the entry point to the log shown by clicking the link.
Support tab The Support tab contains of links to available support services like – ProLiant Essential Software Info, Integrity Essential Software Info, Support Links, and Forum links. Help tab The Help page provides help for the HP System Management Homepage (HP SMH) and its webapps. Using the search option, you can search for a keyword in SMH help and the selected webapps. If the search criterion is valid, a list of all documents matching the query appears.
2 Agent information Management Host agent The Management Host agent gathers data for the HP Host OS MIB.
System Agent Software version information The software version section displays the versions of the system software installed on this machine: BIOS, drivers, and agents. This section also displays a string that specifies the version of HP Insight Management Agents running on the system. Cluster information The cluster information section displays the overall status of a cluster.
• • Client/Internal—The network is used to connect client systems and for internal cluster communication. • None—The network is not used by the cluster for communication. State—Displays the current state of the network, which can be one of the following: • Online—The network is online and functioning normally. • Offline—The network is offline. • Partitioned—The network is operational, but two or more nodes on the network cannot communicate. Typically, a path-specific problem has occurred.
• Orring Diode Failed • Brownout • Give Up On Startup • NVRAM Invalid • Calibration Table Invalid • If the power supply is absent, the status is "Not Applicable" • Used Capacity (%)—Represents the current power supply capacity which is a percentage of its maximum capacity. • Used Capacity (W)—Represents the current power supply capacity in watts. • Max Capacity—Represents the maximum capacity of the power supply in watts. • Model—Represents the power supply model name.
NOTE: A Failed condition does not occur in a client PC since the power supply for the client is cut off if thermal condition reaches a permanently damaging level. • Unknown— If the Server Agents or the Server Agent cannot determine the status of the device, you may need to upgrade your driver software. If you are managing a client with an unknown temperature status, the client may not support thermal detection. • Sensor—The number that uniquely specifies the temperature sensor description.
• Disabled—ECC memory correction is supported, but errors are not logged for this device. • When a certain rate of errors is exceeded the health driver automatically disables logging of these errors, and sends an alarm. The errors are corrected, but are no longer logged. Logging is re-enabled when the driver is reloaded or the operating system restarts. • Not Supported—Logging of correctable memory errors is not available for this device.
• Mirroring—This system is configured for Mirrored Memory Protection. All memory banks are duplicated in Mirrored Memory, as opposed to only one for Online Spare Memory. If enough ECC errors occur, the spare memory is activated and the memory experiencing the errors is disabled. • RAID-XOR—This system is configured for Advanced Memory Protection using the XOR engine. • Advanced ECC—This system is configured for Advanced Memory Protection using the AdvancedEcc engine.
• Other—Memory type can not be determined. • Board—The value determine the memory module is permanently mounted (not modular) on a system board or memory expansion board. • CPQ Single Width Module • CPQ Double Width Module • SIMM • PCMCIA • Compaq Specific • DIMM • Small Outline DIMM • RIMM • SRIMM • DDR2 FB-DIMM • Size - Displays the Size of the memory Module in Mega Bytes. • Technology - Displays the technology of Memory Module.
Management Processor Integrated Lights-Out (iLO) NIC The NIC section displays the following information about the NIC in the iLO. Not all fields are supported by all models of Remote Insight Board and/or NIC. • Model—Displays the NIC model. • DNS Name—Displays the fully qualified DNS name assigned to this iLO. • Type—Displays if the NIC is embedded or pcmcia and whether it is Ethernet or a token ring. • IP Address—Displays the IP address for this NIC.
• Pending Alarm—Displays if the alert is unable to determine the state of the iLO, or if all alerts have been delivered or if there are alerts pending that still need to be sent. If your system supports the Integrated Lights-Out Edition, the following alerts are available: • Remote Insight Alerts—Allow users to enable or disable the alerts by clicking the button. • Host Alerts allow users to enable or disable the alerts by clicking the button.
Self Test Results The Self Test Results section indicates various error-status depending on the Remote Insight model.
Select Reset to Original Values to return to the original threshold values, or the values from the last time the thresholds were saved. This option also clears the Synchronize thresholds for all volumes checkbox so that thresholds can be set individually. Select Save Thresholds to save any thresholds that have been modified and delete any disabled thresholds.
interrupts and DPCs. A high rate of privileged time might be attributable to many interrupts generated by a failing device. This counter displays the average busy time as a percentage of the sample time. • % DPC Time—Percentage of time that the processor spent receiving and servicing deferred procedure calls (DPCs) during the sample interval. DPCs are interrupts that run at a lower priority than standard interrupts.
• Context Block Queue/sec—Rate per second at which the work context blocks must be placed on the FSP queue of the server to await server action. • % Total PageFile Usage (Thresholds Supported) —Amount in percent of the Page File instance in use. For details, see the Process Object: Page File Bytes information. • Available KBytes —Amount of physical memory available to processes running on the computer. It is calculated by summing space on the Zeroed, Free, and Stand-by memory lists.
Nonpaged Bytes, so it might not equal Process: Pool Nonpaged Bytes: _Total. This counter displays the last observed value only; it is not an average. • Cache Copy Reads/sec—Frequency of reads from pages of the file system cache that involve a memory copy of the data from the cache to the application's buffer. • Cache Copy Read Hits %—Percentage of cache copy read requests that hit the cache, that is, they did not require a disk read to provide access to the page in the cache.
• Page Faults/sec—Rate at which the page faults occur in the executing threads within this process. A page fault occurs when a thread refers to a virtual memory page that is not in its working set in main memory. This does not cause the page to be fetched from disk if it is on the standby list and already in main memory, or if it is in use by another process with whom the page is shared.
• • Firmware Primary/Secondary—The array controller is using a primary/secondary algorithm implemented in the controller firmware and the operating system driver. • Unknown—Indicates that the Storage Agents cannot determine the redundancy type for the controller. You may need to upgrade the Storage Agents. Redundancy Error—Displays the redundancy error for the controller. The following values are valid: • No Failure—No failures have been detected.
• • High—Indicates the rebuild priority is high. • Unknown—Indicates that the rebuild priority is not recognized. You may need to upgrade the Storage Agents. Expand Priority—Displays the logical drive expand priority of the controller. The following values are valid: • Low—Indicates the expand priority is low. • Medium—Indicates the expand priority is medium. • High—Indicates the expand priority is high. • Unknown—Indicates that the expand priority is not recognized.
Extension, and Migration are temporarily suspended until the backup power source is fully charged. Array accelerator operations will automatically resume when charging is complete. • • Degraded—The battery pack is still operating, but one of the batteries in the pack has failed to recharge properly. Your board should be serviced as soon as possible. • Not Present—A backup power source is not present. (Some controllers do not have a battery/capacitorbacked cache).
• Redundant Size Mismatch—Cache operations are temporarily disabled. The cache sizes on the redundant controllers do not match. • Redundant Cache Failure—Cache operations are temporarily disabled. The cache on the redundant controller has failed. • Excessive ECC Errors—Cache operations have been permanently disabled. The number of cache lines experiencing excessive ECC errors has reached a preset limit. • ADG Enabler Missing—Indicates that write cache operations have been temporarily disabled.
• Read Errors—Displays the total number of read memory parity errors that were detected while reading from the Array Accelerator. The mirrored copy of data in the write cache can be accessed to obtain correct data if a memory parity error occurs. Memory parity errors occur when the system detects that information has not been transferred correctly. A parity bit is included for each byte of information stored in memory.
• Model—Displays a description of the physical drive. The text depends on the manufacturer of the drive and the drive type. If a drive fails, note the model to identify the type of drive necessary for replacement. • Firmware Version—Displays the physical drive firmware version number. Make sure you have the most recent version of the firmware because older versions may not support all of the newest features. • Serial Number—Displays the serial number assigned to the physical drive.
• • • • Rotating Platters—Indicates that the physical drive media is composed of rotating platters. • Solid State—Indicates that the physical drive media is composed of solid state electronics. • Unknown—Indicates that the Storage Agents cannot determine the media type. Negotiated Link Rate—Displays the negotiated link rate for SAS and SATA physical drives. The possible values are: • • • • Unknown—The Storage Agents cannot determine the drive type.
IMPORTANT: The Start or Stop button only be appears if you are logged on as an administrator or an operator, SNMP Sets are enabled, and a SNMP Community string has been defined with 'write' access. Go back to the Summary page and select login to login as an administrator or operator. SNMP Sets can be enabled in the HP Insight Management Agents control panel applet on the SNMP Settings page.
• Used Realloc—Displays the number of sectors of the reallocation area that have been used by the physical drive. The status of this item can be OK or Replace Drive. If the status is Replace Drive, replace the drive, or an actual drive failure may occur in the future. Because of the nature of magnetic disks, certain sectors on a drive may have media defects. The reallocation area is part of the drive that the drive manufacturer sets aside to compensate for these defects.
• Check the physical proximity of the system to other electrical devices. Since electrical noise may cause a Bus Fault error, check the AC circuit for other electrical devices. • Ensure that the system temperature is within specified limits. Ensure that fans are operating and are not blocked. SCSI Bus Faults can be caused when two or more drives are set to the same SCSI ID. Ensure that storage system and system SCSI IDs do not conflict. In some instances, drive failure can cause SCSI Bus Faults.
If the number of hardware errors is not zero and the drive has failed, replace the drive. If the counter is not zero and the drive is OK (has not failed), there may be an intermittent problem that requires drive replacement. If you observe that the count is increasing over time, replace the drive. • Not Ready Errors—When a physical drive returns a not ready status when it should be ready, a Drive Not Ready Error occurs.
• Recovered Write Errors—Displays the number of write errors corrected through physical drive retries or recovered by a physical drive on a monitored system. Over time, a drive may produce these errors. If you notice an increase in the value shown for Recovered Write Errors or Hard Write Errors, a problem may exist with the drive. The Recovered Write Errors value increases every time the physical drive detects and corrects an error. Only an unusually rapid increase in these errors indicates a problem.
• Rebuild Blocks Left—Displays the number of blocks of data that still need to be redistributed. When the value reaches 0, the rebuilding process is complete. The array continues to operate in interim recovery mode while the drive is rebuilding. • Rebuilding Drive—Identifies the physical drive that failed. The logical drive is rebuilding using a spare drive in place of this failed drive. When the status is Expanding one of the following values displays to indicate the progress of the expansion.
• Sectors Written—Displays the number of sectors written for the logical volume for this interval. This value is expressed in sectors per second. • OS Assigned Name—Displays the operating system name associated with this logical drive. • Multipath Status—Displays the overall multipath status of this logical drive. The following values are valid: • Not Configured—Indicates that this logical drive is not configured to have multipath access.
• Ultra3—The current data transfer speed for this tape library is 80 million transfers per second. • Unknown—The agent is unable to determine the current negotiated data transfer speed for this tape library. NOTE: If the current data transfer width is Narrow (8 bits) then the speed in megabytes per second is equal to the million transfers per second speed. If the current width is Wide (16 bits) then the speed in megabytes per second is twice the million transfers per second speed.
• • Narrow (8 bits)—The negotiated data transfer width for this drive is narrow (8 data bits). • Wide (16 bits)—The negotiated data transfer width for this drive is wide (16 data bits). • Unknown—The Storage Agents are unable to determine the current negotiated data transfer width for this drive. Current Speed—Displays the current negotiated data transfer speed for Parallel SCSI tape drives. The possible values are: • Asynchronous—The current data transfer speed for this drive is asynchronous.
• Rewrites—Displays the number of times blocks that had to be rewritten to the device. This value is maintained since the Tape Hardware Interface driver was loaded. Rewrite errors may occasionally occur. If this value should rise dramatically, you may need to clean the device. If you continue to have rewrites, you may have a problem.
• SAS Attached—This chassis is attached to the server with a SAS cable. • Unknown—The Storage Agents are unable to determine the type of connection. • Drive Bays—Displays the number of drive bays provided by this storage system. If duplexing hardware is used with the storage system, the drive bay number is less than the number of physical drive bays in the enclosure. • Model—Displays the model of the storage system. Use this information for identification purposes.
• IDE ATA disk drives • IDE ATA logical drives IDE controller information Select a controller entry from the Mass Storage list to display the following information: • Model—Displays the controller’s model string, used for identification purposes • Slot—Displays the physical slot number where the controller is installed in the system or N/A if slot number is not available • Firmware Version—Displays the firmware version of the controller IDE ATAPI devices The information displayed for each IDE ATAP
• Serial Number—Displays the serial number of the disk drive. • Firmware Revision—Displays the firmware version of the disk drive. • Capacity—Displays the size of the drive. • Transfer Mode—Displays the data transfer mode of the disk drive. The following values are valid: • PIO Mode 0—The data transfer mode is programmed input/output mode 0. • PIO Mode 1—The data transfer mode is programmed input/output mode 1. • PIO Mode 2—The data transfer mode is programmed input/output mode 2.
• Unknown—The agent cannot determine the RAID level of this logical drive. You might need to upgrade your software. • Capacity—Displays the size of the logical drive. • Stripe Size—Displays the size of a logical drive stripe in kilobytes. • Disk Rebuilding—Identifies the physical drive that is being rebuilt. The identity of the physical drive only displays when the status of the logical drive is Rebuilding, otherwise, N/A displays.
• Firmware Version—Displays the SCSI controller’s BIOS firmware version number. This information is not available for all SCSI controllers. • Bus Width—Displays the physical width of the data transfer bus of the SCSI controller. The following values are valid: • • Narrow (8 bits)—The controller supports a narrow 8-bit data transfer bus. • Wide (16 bits)—The controller supports a wide 16-bit data transfer bus. • Unknown—The agent is unable to determine the physical width of the data transfer bus.
• Degraded—Indicates that the library has degraded in some manner. • Failed—Indicates that the library has failed and can no longer return data. The library might need to be replaced. • Offline—Indicates that the Storage Agents can no longer communicate with the library. This could be caused by a cabling problem or the library might be powered off. • Unknown—The status of the tape library cannot be determined. Ensure the latest drivers and Storage Agents are installed.
• OK—Indicates the tape drive is operating normally. • Failed—Indicates the tape drive has failed and might need to be replaced. • Offline—Indicates the tape drive is offline and can no longer return data. No further status is available. • Missing—Was OK—Indicates a tape drive that was located in the system and had a status of OK, which has been removed. • Missing—Was Failed—Indicates a tape drive that was located in the system and had a status of failed has been removed.
Having a large number of retry corrected errors does not necessarily indicate that the drive is failing. However, as a precaution, replace a drive that has an abnormally high amount of errors when compared to similar drives. If this count increases rapidly, you might need to clean or replace the drive. • Uncorrectable—Displays the number of read errors that could not be recovered by a tape drive’s ECC algorithm, retries, or any other recovery mechanism. Over time, a drive might produce these errors.
• Unknown—The Storage Agents do not recognize the drive enclosure. You might need to upgrade your software. • Vendor—Displays the name of the vendor that produces this drive enclosure or box type. Use this information for identification purposes. • Model—Displays the model of the storage system. Use this information for identification purposes. • Firmware Revision—Displays the firmware revision of the drive enclosure or box. Use this information for identification purposes.
• Not Configured—The physical drive is not configured. Ensure that all of the drive switches are properly set. • Bad Cable—A physical drive is not responding. Check the cables connected to the drive. • Predictive Failure—One of the physical drive thresholds has been exceeded. • Offline—The physical drive is offline and can no longer return data. No further status is available. • Missing was OK—A physical drive that was located in the system and had a status of OK has been removed.
• Used Reallocs—Displays the number of sectors of the reallocation area that have been used by the physical drive. Because of the nature of magnetic disks, certain sectors on a drive might have media defects. The reallocation area is part of the drive that the drive manufacturer sets aside to compensate for these defects. The controller writes information addressed from these unusable sectors to available sectors in the reallocation area.
NOTE: If sectors read and written are always zero or N/A on Microsoft Windows 2000 you must install Service Pack 2 or higher. You also must enable the logical and physical disk performance counters. Run DiskPerf.exe -Y in a command window and then reboot the system. • Hard Read Errors—Displays the number of read errors that could not be recovered by a physical drive’s ECC algorithm, retries, or any other recovery mechanism.
SCSI logical drives Select a SCSI logical drive from the SCSI controller submenu to display the following information. The following values are valid: • Status—Shows the status of the physical drive selected. • OK—The logical drive is in normal operation mode. No user action is required. • Failed—There are more failed physical drives than the fault tolerance mode of the logical drive can handle without data loss. • Unconfigured—The logical drive is not configured.
Spare drives A list of spare drives that can be used by this logical drive to replace a failed drive. Select one of the listed spare drives to see more information about the drive. SCSI bus information Select a SCSI device from the SCSI controller submenu to display more information about the device. The following information might appear depending on the type of device: • Parity Errors—Displays the number of parity errors that occurred on the SCSI bus while the bus was processing commands.
NOTE: If the current data transfer width is Narrow (8 bits) then the speed in megabytes per second is equal to the million transfers per second speed. If the current width is Wide (16 bits) then the speed in megabytes per second is twice the million transfers per second speed. For example, if the current speed is Ultra and the width is Wide then the speed would be 40 megabytes per second.
Use the ASR Reset Limit feature in conjunction with the ASR Reset Count feature in the same window. The ASR Reset Count feature displays the number of times that ASR has rebooted the server. If the ASR Reset Count is approaching the reset limit, immediately investigate the server for problems by checking the Critical Error Log and running Diagnostics. • ASR Reset Count—Displays how many times the ASR feature has rebooted the server. ASR reboots (or resets) the server a limited number of times.
• Serial Number—Displays the Physical serial number of the device or client system board. Use this number for identification and registration purposes. N/A appears if you do not have a device or client that supports the asset management feature. Use the System Configuration Utility (or the appropriate utility for your device or client) to enter a system serial number if one does not appear and you have a device or client that supports the asset management feature.
• Other—The system does not support Advanced Memory Protection or the Management Agent cannot determine the status. • Not Protected—This system supports Advanced Memory Protection but the feature is disabled. • Protected—The system supports Advanced Memory Protection. The feature is enabled but not engaged. • Degraded—The system was protected, but the Advanced Memory Protection has been engaged; therefore Advanced Memory Protection is no longer available.
• Advanced Memory Protection Condition—displays the current condition of the Advanced Memory Protection subsystem. The following states are supported: • Other—The system does not support fault tolerant memory or the Management Agent cannot determine the state. • OK—This system is operating normally. • Degraded— The Advanced Memory Protection sub-system has been engaged. Schedule server down time to replace the deactivated memory.
• FPM (Fast-Page Mode) • EDO (Extended Data Out) • BEDO (Burst Extended Data Out) • Synch DRAM (Synchronous DRAM) • Unknown System Resources This section lists the resources in use by the device or client workstation in the following order: • IRQ Numbers—The Interrupt Request number displays, followed by the slot number of the board that is using this interrupt. • Port Address—The port address range displays, followed by the slot number of the board that is using this I/O port range.
• Monitor Serial Number displays the serial number for the monitor. Use this number for identification purposes. • Monitor Manufacture Date displays the monitor's date of manufacture date Enclosure Information • If your system is a blade server based system, the navigation frame displays the Enclosure Information link under the Configuration section. The middle Navigation frame is the Enclosure Information window and it displays the detailed information about the enclosure.
• Enclosure Model • Asset Tag • Part Number • Spare Pat Number • Serial Number • Firmware Revision • Previous Enclosure Name • Next Enclosure Name • Height \ Width \ Depth • Unit Identification LED • Previous Enclosure Serial Number • Next Enclosure Serial Number • Address • Maximum Blade Number • Enclosure Blade Information • Name • Part Number • Spare Part Number • Position (Slot Number) • Height \ Width \ Depth • Number of Bays Occupied • Enclosure Fuses • Con
Namespace: root\default Object Class: CPQ_System_Performance Subclasses: • • • • • • • CPQ_System • ContextSwitchRate • CpqQueueLength • Processes • RegistryUsage • SystemUpTime • TotalThreads CPQ_Server • AccessPermissionErrors • ContextBlockQueueRate • GrantedAccessErrors • LogonErrors • ServerSessions • SessionsErroredOut • TotalByteRate CPQ_Processor • CpuTimePercent • CpuUserTimePercent • InterruptRate • PercentDPCTime • PercentInterruptTime • PrivelegedCpuTi
• • • • • DiskWriteBytesPersec • DiskWritesPersec • PhysicalDisk CPQ_LogicalDisk • DiskQueueLength • DiskTimePercent • FreeMegabytes • FreeSpacePercent • LogicalDisk CPQ_NetworkInterface • BytesReceivedPersec • BytesSentPersec • CurrentBandwidth • NetworkInterface • OutputQueueLength • PacketOutboundErrs • PacketRate • PacketReceiveErrs • PacketsReceivedPersec • PacketsSentPersec • TotalByteRate CPQ_Tcp (CPQ_Tcpv4 for Windows Server 2003) • ConnectionFailures • C
IMPORTANT: To mark entries as corrected, the agents must have sets enabled and the SNMP Community string must be correct. The following list describes errors that might be logged. If any of these errors occur, run System Diagnostics on the system or see the software documentation. • Abnormal Program Termination—A device has detected a fatal software error resulting in a device failure. • ASR Base Memory Parity Error—The system detected a data error in base memory following a reset because an ASR timeout.
• Server Manager Failure—An error occurred in the server interface with the Server Manager. • UPS A/C Line Failure/Shutdown or Battery Low—The device has initiated a UPS or operating system shutdown, or the battery is almost depleted after an AC line failure. The Last Failure Message on this window displays the last failure message associated with a critical error. Correctable errors This alarm indicates that a block of memory has failed or is failing and might need to be replaced.
3 Subsystem specific to a NetWare operating system Operating system overview HP now provides operating system management for NetWare environments. The NetWare operating system information is displayed when the server being monitored running NetWare 4.x or NetWare 5.0 with Novell NetWare Management Agent.
File System page The File System page provides the file system information for the server. The page is divided into the following three sections: • File System • File Volume • Open Files File System The File System section displays the following information: • Reads (Kbytes)—The total number of Kilobytes read by the file system. This value provides a measure of server activity. • Writes (Kbytes)—The total number of Kilobytes written by the file system.
General information The General Information section displays the following information: • User Count—The number of entries in the User Account Table. • Logged-In Users—The number of licensed connections (logins) in this file server. • Maximum Logins—The maximum number of licensed connections (logins) supported by this file server. The value is zero if the maximum number is unlimited. • Connection Count—The current number of entries in the Connection Table.
• Memory (bytes) (sortable)—The total memory, in bytes, used by the NLM. This value is a composite of Short Term Memory, Semi-Permanent Memory, and Non-movable Cache Memory allocated by the NLM, plus the sizes of the code and data sections of this instance of an NLM. • Description (sortable)—A brief description of the NLM. • Version (sortable)—The major and minor version numbers of the NLM. Server Parameter page The Server Parameter page includes a table of the NetWare set parameters.
• InwDos • Other • Description (sortable)—A brief description of this partition. • Size (sortable)—The size (in Kilobytes) of this physical partition. Adapter Information page The Adapter Information page displays general information for each adapter board in the host. The Adapter table is sorted by the Description value by default. Description—A description of the hardware information for the adapter. The description usually includes manufacturer, model, and version information.
4 CR3500 RAID Array SCSI controller Mass storage RAID Array This section displays RAID array information. Five banners appear in this section. RAID array status • • Status—Displays the status of the RAID array. The following conditions are valid: • Good—The RAID array is fully operational. • Reduced—The RAID array is operating in a degraded or reduced state. One or more of the physical drives that make up the RAID array are either missing or failed.
• Formatting—The drive is currently being formatted.
• Critical—The controller temperature sensor has detected a critical temperature condition in the primary enclosure. • Non-critical—The controller temperature sensor has detected an abnormal temperature condition in the primary enclosure. • Unknown—The enclosure temperature information is unavailable. • Primary enclosure temperature—Displays the current primary enclosure temperature in degrees Celsius. • Primary enclosure fan status—Displays the current primary enclosure fan status.
5 Where to go for additional help In addition to this guide, the following information sources are available: • HP Insight Management Agents 7.30 Installation Guide • HP Insight Manager software Telephone numbers For the name of the nearest HP authorized reseller, see the HP website http://www.hp.com/service_locator. For HP technical support: • In North America: • Call 1-800-HP-INVENT (1-800-474-6836). This service is available 24 hours a day, 7 days a week.
Appendix A Troubleshooting Insight Management Agents for Servers issues Inability to perform remote reboot on a server from the Management Console 1. Load CPQAGIN. 2. Verify that Remote Reboot is enabled. 3. Verify that Sets are enabled.
When attempting to browse to Web-Enabled System Management software on port 2381, the system is not accessible because of an invalid password This issue is due to either of the following conditions: • This system is not fully configured and is not accessible because there is not a valid administrator password. An administrator password must be configured by either reinstalling the Web-enabled System Management software or following the instructions in the Security white paper located at http://www.hp.
d. Click Reset>OK. • There are known browser issues in the Management Agents for Tru64 UNIX. However, many have been corrected in later releases. For additional information, see the Management Agents for AlphaServers for Tru64 UNIX Reference Guide. SNMP community string issues • In NetWare, the community string can be changed through the INETCFG utility. After the community string has been changed, the administrator must restart the server at a convenient time to have the change take effect.
4. Click OK. When prompted to restart the Management Agents, click Yes. Insight Manager cannot manage a system If the Microsoft® SNMP service was installed after installing the Management Agents for Servers, run Install from the Management CD, and select Express to automatically update the Management Agents. Cannot delete the CPQMGMT.CPL file when uninstalling or upgrading When running Windows® 2000, close the Control Panel before deleting the CPQMGMT.CPL file.
NOTE: The HP Diagnostics utility initializes physical drives attached to HP Drive Arrays. Disk Subsystem button disabled in the Disk Storage window This condition might result because the Drive Array Agent is not loaded. Open the Management Agents by selecting the icon from the Windows® Control Panel. Verify that the Drive Array Information is located in the Active Agents lists. SCSI Adapter button is disabled This condition might result because the HP device driver is not loaded.
The HP Foundation Agents service could not terminate agent "CPQMHOST." The data contains the error code. The HP Foundation Agents service could not start agent "CPQMHOST." The data contains the error code. • NIC information does not appear. • Server Status Information appears incorrectly. For example, the Server Status information is highlighted in green. However, when the customer drills down to mass storage, the Server Status information is highlighted in red.
System restart to disk-based utilities fails for NetWare If you click Reboot on the Insight Manager display, and select the option to boot to the disk-based utilities, the server might fail to start the disk-based utilities. Use the System Configuration utility to verify that the utilities are actually installed on the system partition. Inability to view Web pages on the NetWare server 1. Verify that the latest Novell operating system patch is installed on the server to provide a recent version of TCPIP.
Glossary Automatic Server Recovery (ASR) A server feature designed to automatically restart the server after a critical hardware or software error. If a critical error occurs, the server records the error in the Server Health Logs, reboots the system, and pages (if a modem is installed in the server). Client A computer connected to a server on the network. Community String The SNMP Community String is similar to a password, offering a limited amount of protection for the SNMP data.
Simple Network Management Protocol (SNMP) SNMP defines a set of commands that a management application uses to retrieve or change the values of items a management agent makes available. SNMP Multiplexing (SMUX) The protocol defining a mechanism for communication between SNMP agent and multiple user daemons (called SMUX peers). The SMUX protocol has the advantage of being vendor-independent.
Index A F nodes, cluster, 22 Novell NetWare: community string settings, 90 accounts, user, 8 Adapter Information Page, 83 array controllers, 84 ASR POST failure, 93 File System Page, 80 Foundation Agents: configuration subsystem, 22 O B browser, 89 browser requirements, 5 C Client data collection, 21 clusters: Foundation Agents, 22; RAID Array controller, 85 colors in browser, 89 community strings, SNMP, 90, 93 community strings, SNMP, 91 Compaq CR3500 RAID Array SCSI Controller: clustered controller
software, cluster, 23 spare drives: RAID Array, 84 subsystem button, disabled, 92 Summary Page, 79 System Management Homepage, 9, 11 system restart problems, 94 T tape device errors, 93 telephone numbers, 87 thresholds: SNMP, 92 trap messages: troubleshooting, 93 troubleshooting: Web-enabled Management Agents, 89 troubleshooting, 90 U user accounts, 8 User Information Page, 80 V values, inability to change, 93 W WEBAGENT.