
User's Manual


User Interface StorView* Enclosure Management Software User Guide
Revision 1.1
4
• Identify Selected Drives (page 18) (drive)
• View VPD Data (page 16) (drive)
• Upgrade Drive Firmware (page 22) (drive)
• Download ESI Firmware (page 11) (controller)
• Set Alarm State (page 22) (enclosure)
• Change Enclosure Name (page 17) (enclosure)
• Rescan Enclosures (page 21)
• License Manager (page 12)
• Save Configuration to File (page 21)
• Tip of the Day - Displays an informative tip.
• Help Topics - Displays the on-line help.
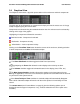
Side Panel
To the right of each enclosure is the Side Panel, which shows information about the selected
enclosure, including some things not available in the main display (such as environmental
status):
Note: For attached JBODS, depending on how the enclosure's SES (SCSI Enclosure Services)
behaves, some components may be aggregated. For example it is quite common for several
temperature sensors to be reported as one.
Two tabs are shown in the window:
The Indicators tab shows a number of icons:
The Controller icons show the status of the controllers (attached JBODS only).
The Fan icons will rotate if the fans are operating correctly (or they will be marked "OK" if
Animate has been turned off). Below each fan is the text "slow", "med" or "fast". This is not
an indication of an error, simply a rough measure of the fan speed.
The Alarm icon shows whether the enclosure beeper is sounding.
The Sensor icons represent the temperature sensors and are marked with the current
temperature in degrees Celsius. The barometer will be green for normal operation, blue and
low if the temperature is below the lower threshold, or red and high if the temperature
exceeds the upper threshold.