
Datasheet


14
GridVis Software
▼
Software
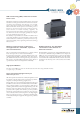
The GridVis software is included in the standard content of delivery of the UMG 511 and UMG 605 measurement devices. The software
helps you to read out and graphically present measurement data either online as actual values or from the measurement value memory. The
data can be displayed as a line graph, bar chart or histogram. The EN 50160 and EN 61000-2-4 analysis tools allow the rapid analysis of
both standards. At a glance, it is easier to identify whether the standards are fulfilled throughout the respective measurement period and a
copy can be directly created on paper or as a PDF document.
Ill.: Screenshot GridVis Software with various graphs
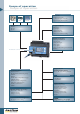
Ill.: Automatically generated power quality report