73 Series Spectrophotometer PC Software Operating Manual REV A/06-10
Contents Contents.....................................................................................................................3 SECTION 1 - INSTALLATION....................................................................................5 SECTION 2 – GETTING STARTED...........................................................................8 2.1 2.2 2.3 Connection............................................................................................................................ 8 Login ......
6.1.3 6.1.4 6.1.5 6.1.6 6.1.7 6.1.8 6.2 6.2.1 6.3 6.4 Selecting concentration units.............................................................................................. 42 Setting the resolution .......................................................................................................... 43 Operating mode .................................................................................................................. 43 Selecting number of standards ..................................
SECTION 1 - INSTALLATION Insert the Jenway 73 Series software installation CD. The CD should auto run, if not open My Computer, open CD drive and double click on the Jenway 73 series software icon. The Setup Wizard will open. Follow the instructions to install the software in the required location.
Once the software is installed click Close and the software installation is complete.
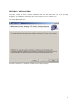
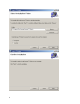
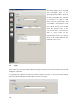
SECTION 2 – GETTING STARTED 2.1 Connection Ensure that the PC and the spectrophotometer are connected via the interface cable, open the 73 series software. If there is no instrument connected this screen will be shown.
When an instrument is connected this screen will be shown. Click on Connect to open communication between the PC and the spectrophotometer. If the PC software doesn’t find an attached device ensure that the spectrophotometer is switched on and click Refresh.
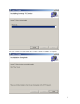
The model number, accessory fitted and wavelength range of the spectrophotometer will be shown in the device information box. If the PC is connected to a 7300 or 7305 model only the photometrics and concentration measurement mode icons will be shown on the toolbar down the left-hand side of the screen. If the PC is connected to a 7310 or 7315 model all five measurement mode icons will be shown on the toolbar down the lefthand side of the screen. 2.
2.3 Register Register your software/instrument by clicking on Help on the toolbar at the top of the screen. Click on Register and if the computer is connected to the internet this link will take you directly to the warranty registration page on Jenway.com. Complete the warranty registration to receive the three year spectrophotometer warranty.
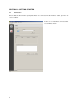
SECTION 3 – PHOTOMETRICS To open the photometrics measurement mode click on the photometrics icon on the toolbar down the left-hand side of the screen. The toolbar at the top on the tab contains all the commands for this measurement mode. The active buttons are in bold; the deactivated buttons are greyed out.
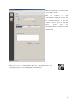
3.1 Settings To set the measurement parameters click on the Settings button. This screen allows the batch name, wavelength and resolution to be set. If Auto Logging is required the parameters can be set in this screen. Comments can be entered which will be included on the result printouts. Once the required measurement parameters have been entered click on the OK button to accept and continue with calibration and sample measurement.
3.1.2 Setting the wavelength To select the wavelength that the zero calibration and sample measurements will be performed at type the wavelength into the text box. If a value entered is outside of the range of the spectrophotometer an error icon will be displayed and this must be corrected before the settings screen can be exited. Only numeric values can be entered. 3.1.3 Setting the resolution The resolution of the absorbance and % transmittance reported is selectable between 0, 0.0, 0.00 or 0.000.
3.1.4 Auto Logging Auto logging allows repeat measurements of the same sample to be performed with a set time interval between each measurement. Use the arrow icons to increase or decrease the time interval between sample measurements and use the arrow icons to select the number of readings required. If auto logging is not required the values do not need to be adjusted in this screen. 3.2 CALIBRATION Once the settings have been entered the zero calibration should be performed.
To continue click Yes, to cancel click No or Cancel. If the wavelength is changed then the zero calibration must be performed again at the new wavelength, before a sample can be measured. Alternatively a new photometrics tab can be opened and the required settings can be entered. 3.3 SAMPLE MEASUREMENT Insert the cuvette containing the sample into the sample chamber and close the instrument lid. Click on the Read button; the instrument performs the measurement and result is displayed on the screen.
If the same sample needs to be measured more than once click on the Auto Log button. The instrument will perform the required number of readings with the specified time interval between each measurement as set in the Settings screen. The results will be displayed on the screen. The batch name entered in the settings screen will have 01, 02 etc after the name, to signify the order in which the results were generated.
SECTION 4 – Concentration To open the concentration measurement mode click on the concentration icon on the toolbar down the left-hand side of the screen. The toolbar at the top on the tab contains all the commands for this measurement mode. The active buttons are in bold; the deactivated buttons are greyed out.
4.1 Settings To set the measurement parameters click on the Settings button. This screen allows the batch name, wavelength, resolution, concentration units, factor and standard values and to be set. If auto logging is required the parameters can be set in this screen. Comments can be entered which will be included on the result printouts. Once the required measurement parameters have been entered click on the OK button to accept and continue with calibration and sample measurement.
4.1.1 Batch name The batch name entered here will be reflected on the name tab at the bottom of the screen and under sample name in the results table once results have been generated. 4.1.2 Setting the wavelength To select the wavelength that the zero calibration and sample measurements will be performed at type the wavelength into the text box.
4.1.3 Setting the resolution The resolution of the absorbance and % transmittance reported is selectable between 0, 0.0, 0.00 or 0.000. Click on the arrow on the drop down box to select the resolution required. 4.1.4 Selecting concentration units The units of concentration can be selected from a number of options: no units, %, ppm, EBC, SRM, mEq/l, mEq, M, mM, µM, nM, U, U/l, U/ml, g/l, mg/l, µg/l, ng/l, g/dl, mg/dl, µg/dl, mg/ml, µg/ml, ng/ml, µg/µl, ng/µl, mol/l, mmol/l.
4.1.5 Entering a factor To select the factor to be used type the factor value into the text box. Factor values of 0.001 to 10,000 can be entered. If the value entered is outside of the range an error icon will be displayed and this must be corrected before the settings screen can be exited. If the factor is not known the value entered should be 1 and a standard should be measured in order to calculate the factor. 4.1.
4.1.7 Auto Logging Auto logging allows repeat measurements of the same sample to be performed with a set time interval between each measurement. Use the arrow icons to increase or decrease the time interval between sample measurements and use the arrow icons to select the number of readings required. If auto logging is not required the values do not need to be adjusted in this screen. 4.
wavelength. However a warning will be displayed to warn that critical settings are being changed after the zero calibration has been performed. To continue click Yes, to cancel click No or Cancel. If the wavelength is changed then the zero calibration must be performed again at the new wavelength, before a sample can be measured. Alternatively a new concentration tab can be opened and the required settings can be entered.
If the same sample needs to be measured more than once click on the Auto Log button. The instrument will perform the required number of readings with the specified time interval between each measurement. The results will be displayed on the screen. The batch name entered in the settings screen will have 01, 02 etc after the name, to signify the order in which the results were generated. auto logging can be stopped before all the measurements have been completed by clicking on the Stop button.
Click on the Standard button. The instrument will take a reading and calibrate to the standard Once the concentration. calibration is complete the Read and Auto Log buttons are active and the sample can be measured. If the settings menu is re-entered following the standard calibration it is possible to change the wavelength. However a warning will be displayed to warn that critical settings are being changed after the zero calibration has been performed.
Insert the cuvette containing the sample into the sample chamber and close the instrument lid. Click on the Read button; the instrument performs the measurement and result is displayed on the screen. If the same sample needs to be measured more than once click on the Auto Log button. The instrument will perform the required number of readings with the specified time interval between each measurement. The results will be displayed on the screen.
SECTION 5 – SPECTRUM To open the spectrum measurement mode click on the spectrum icon on the toolbar down the left-hand side of the screen. The toolbar at the top on the tab contains all the commands for this measurement mode. The active buttons are in bold; the deactivated buttons are greyed out. The spectrum measurement mode also displays the status at the end of the toolbar.
5.1 Settings To set the measurement parameters click on the Settings button. This screen allows the sample name, start and end wavelengths, scan interval, resolution, and operating mode to be set. If Auto Logging is required the parameters can be set in this screen. Comments can be entered which will be included on the result printouts. Once the required measurement parameters have been entered click on the OK button to accept and continue with calibration and sample measurement.
5.1.1 Sample name The sample name entered here will be reflected on the name tab at the bottom of the screen.
5.1.2 Setting start and end wavelengths This function enables the start and end wavelengths of the spectrum scan to be set. To select the wavelength range that the baseline scan and sample scan will be performed across type the start and end wavelengths into the text boxes. If a value entered is outside of the range of the spectrophotometer an error icon will be displayed and this must be corrected before the settings screen can be exited. Only numeric values can be entered. 5.1.
5.1.4 Setting the resolution The resolution absorbance of the or % transmittance reported is selectable between 0, 0.0, 0.00 or 0.000. Click on the arrow on the drop down box to select the resolution required. 5.1.5 Selecting operating mode The results displayed can be either absorbance transmittance. or To % select absorbance click in the circle adjacent to Absorbance; to select transmittance click in the circle adjacent to Transmittance.
5.1.6 Auto Logging Auto logging measurements allows of repeat the same sample to be performed with a set time interval between each measurement. Use the arrow icons to increase or decrease the time interval between sample measurements and use the arrow icons to select the number of readings required. If auto logging is not required the values do not need to be adjusted in this screen. 5.
At continue click Yes, to cancel click No or Cancel. If the wavelength is changed then the baseline must be performed again at the new wavelength and scan interval, before a sample can be measured. Alternatively a new spectrum tab can be opened and the required settings can be entered. 5.3 SAMPLE MEASUREMENT Insert the cuvette containing the sample into the sample chamber and close the instrument lid.
The spectrum measurement mode displays the result both graphically and in tabular format. It is possible to zoom in on areas of interest on the graph by clicking on the graph and holding down the left mouse key then dragging the mouse over the required area. To reset the chart to the original scale click on Chart on the toolbar at the top of the screen, then click on Reset. The chart will return to the original scale.
5.4.2 Peaks and Valleys Table The peaks and valleys table can be viewed by clicking on the Analysis button on the toolbar at the top of the page tab. The peaks and valleys displayed depend on the peaks and valley threshold level which has been set. Refer to section 5.4.1 for more details. The information displayed here can be printed off. Refer to section 11 for more details on printing options.
5.4.3 Spectral points analysis The analysis area on the right-hand side of the screen allows points of interest to be selected from the graph and added to the spectral points analysis table which can be printed off. By clicking on a point of interest on the graph the corresponding wavelength and either absorbance or % transmittance value is shown in the analysis area. By clicking on the Add point to analysis selection this adds the point to the table.
SECTION 6 - QUANTITATION To open the quantitation measurement mode click on the quantitation icon on the toolbar down the left-hand side of the screen. The toolbar at the top on the tab contains all the commands for this measurement mode. The active buttons are in bold; the deactivated buttons are greyed out. There are also two tabs in this screen, the measurement tab and the curve tab.
tab displays all the results, the curve tab displays the current standard curve.
6.1 Settings To set the measurement parameters click on the Settings button. This screen allows the sample name, wavelength, concentration units resolution, operating mode, number of standards and curve fit to be set. If auto logging is required the parameters can be set in this screen. Comments can be entered which will be included on the result printouts. The standard curve can also be viewed by clicking the Show Curve button.
6.1.1 Sample name The sample name entered here will be reflected on the name tab at the bottom of the screen and under sample name in the results table once results have been generated.
6.1.2 Setting the wavelength To select the wavelength that the zero calibration and sample measurements will be performed at type the wavelength into the text box. The selected wavelength should be the same wavelength that the standards were or will be measured at. If a value entered is outside of the range of the instrument an error icon will be displayed and this must be corrected before the settings screen can be exited. Only numeric values can be entered. 6.1.
6.1.4 Setting the resolution The resolution of the absorbance or % transmittance concentration reported and is selectable between 0, 0.0, 0.00 or 0.000. Click on the arrow on the drop down box to select the resolution required. 6.1.5 Operating mode The results displayed can be either absorbance or % transmittance. To select absorbance click in the circle adjacent to Absorbance; to select transmittance click in the circle adjacent to Transmittance.
6.1.6 Selecting number of standards The number of standards used to create a standard curve can be changed from 2 to 6 standards. To select the required number of standards used click on the arrow box on the drop down box and select either 2, 3, 4, 5 and 6. If there is only available the one standard concentration measurement mode should be used. 6.1.
6.1.8 Auto Logging Auto logging allows repeat measurements of the same sample to be performed with a set time interval between each measurement. Use the arrow icons to increase or decrease the time interval between sample measurements and use the arrow icons to select the number of readings required. If auto logging is not required the values do not need to be adjusted in this screen. 6.
6.2.1 Measuring Standards Insert the cuvette containing the blank sample into the sample chamber and close the instrument lid. Click on Measure adjacent to the Blank. The instrument will perform a zero calibration. When the calibration is complete the red flag turns green. Insert the cuvette containing the first standard to be measured into the sample chamber instrument and lid. close the Click on Measure adjacent to Std 1. When the measurement is complete the red flag turns green.
Once the standards have been measured click on Show Curve to view the quantitation curve. The curve fit can be adjusted in this screen. Click on Close window to return to the create curve screen. Click on OK to save and return to the measurement mode. 6.3 CALIBRATION Once the settings have been entered and if required a new quantitation curve has been created, the zero calibration should be performed. Insert the cuvette containing the blank sample into the sample chamber and close the instrument lid.
To continue click Yes, to cancel click No or Cancel. If the wavelength is changed then the zero calibration must be performed again before a sample can be measured. The standard samples should also be re-measured at the new wavelength. Alternatively a new quantitation tab can be opened and the required settings can be entered and a new quantitation curve can be created. 6.4 SAMPLE MEASUREMENT Insert the cuvette containing the unknown sample into the sample chamber and close the instrument lid.
If the settings menu is re-entered following sample measurement it is not possible to change the wavelength. A new quantitation tab can be opened and the new wavelength can be entered.
SECTION 7 – Time Scan Kinetics To open the time scan kinetics measurement mode click on the time scan kinetics icon on the toolbar down the left-hand side of the screen. The toolbar at the top on the tab contains all the commands for this measurement mode. The active buttons are in bold; the deactivated buttons are greyed out.
7.1 Settings To set the measurement parameters click on the Settings button. This screen allows the sample name, wavelength, kinetics run time, time interval, concentration units and resolution, operating mode, lag time, start on level to be set. If auto logging is required the parameters can be set in this screen. Comments can be entered which will be included on the result printouts. The standard curve can also be viewed by clicking the Show Curve button.
7.1.1 Sample name The sample name entered here will be reflected on the name tab at the bottom of the screen and under sample name in the results table once results have been generated.
7.1.2 Setting the wavelength To select the wavelength that the zero calibration and sample measurements will be performed at type the wavelength into the text box. The wavelength should be the selected same wavelength that the standards were or will be measured at. If a value entered is outside of the range of the instrument an error icon will be displayed and this must be corrected before the settings screen can be exited. Only numeric values can be entered. 7.1.
7.1.4 Selecting time interval The time interval that the kinetics measurements are recorded at is selectable between 1, 5, 10, 30 or 60. Click on the arrow on the drop down box to select the time interval required. If 60 seconds is selected the instrument will only take a kinetics reading every 60 seconds. 7.1.5 Setting the resolution The resolution of the absorbance or % transmittance concentration reported and is selectable between 0, 0.0, 0.00 or 0.000.
7.1.6 Selecting concentration units The units of concentration can be selected from a number of options: no units, %, ppm, EBC, SRM, mEq/l, mEq, M, mM, µM, nM, U, U/l, U/ml, g/l, mg/l, µg/l, ng/l, g/dl, mg/dl, µg/dl, mg/ml, µg/ml, ng/ml, µg/µl, ng/µl, mol/l, mmol/l. Click on the arrow on the drop down box to select the units required. 7.1.7 Operating mode The results displayed can be either absorbance or % transmittance.
7.1.8 Setting lag time or start on level In this measurement mode it is possible to delay commencement of the the kinetics measurements by setting a lag time or a start on level. The lag time is the amount of time that the instrument will wait before starting the kinetics measurements. The start on level is the absorbance level that must be reached before commencing the kinetics measurements. To select a lag time type the required time in seconds in the text box.
7.1.9 Auto Logging Auto logging allows repeat measurements of the same sample to be performed with a set time interval between measurement. each Use the arrow icons to increase or decrease the time interval between sample measurements and use the arrow icons to select the number of readings required. If auto logging is not required the values do not need to be adjusted in this screen. 7.
To continue click Yes, to cancel click No or Cancel. If the wavelength is changed then the zero calibration must be performed again before a sample can be measured. Alternatively a new time scan & kinetics tab can be opened and the required settings can be entered. 7.3 SAMPLE MEASUREMENT Insert the cuvette containing the sample into the sample chamber and close the instrument lid. Click on the Scan button; the instrument initiates the scan and the live spectrum scan is displayed on the screen.
It is possible to zoom in on areas of interest on the graph by clicking on the graph and holding down the left mouse key then dragging the mouse over the required area. To reset the chart to the original scale click on Chart on the toolbar at the top of the screen, then click on Reset. The chart will return to the original scale.
SECTION 8 - SAVING AND OPENING METHODS In all of the measurement modes it is possible to save the method parameters. There is no limit on the number of methods which can be saved. 8.1 Saving method parameters In any of the measurement modes click on the Settings button. Enter the required method parameters. To exit the settings menu without saving any measurement parameters click on the Cancel button. To save the measurement parameters for future use click on the Save button.
SECTION 9 – SAVING AND OPENING RESULTS There is no limit on the number of results which can be saved. 9.1 Saving results In any of the measurement modes to save a result click on the File button on the top toolbar. Click Save As. The result can be saved in any location. It is advised to use ‘result’ in the file name in order to easily differentiate between methods and results. Or alternatively create a separate folder for methods and results.
The saved result will be displayed. Only the settings and post measurement tools will be active. The Zero, Read and Auto Log buttons will not appear. SECTION 10 – Exporting to Excel To export a result to Excel© in any measurement mode click on the File button on the top toolbar and click Export to Excel. A progress bar will be displayed to show data is being exported. An Excel spreadsheet will open with the exported results displayed.
To select the required option put a tick in the box adjacent to the option. To remove an option un-tick the box adjacent to the option. The page setup options allow the page orientation, margins and printer to be selected. The print chart option enables the chart to be printed. The print table option enables the table of results to be printed. The print analysis option enables any analysis results to be printed.
SECTION 12 – ACCESSORIES When the PC software is connected to the instrument it will communicate with the instrument to find out if there is an active accessory fitted. The automated 8 cell changer, sipper pump, peltier and combined peltier sipper pump can be controlled using the PC software. To open the control for the accessory click on the Accessories tab on the toolbar at the top of the screen and select the required accessory.
To open the control for the accessory click on the Accessories tab on the toolbar at the top of the screen and click Sipper accessory. To operate in manual mode click the forwards or backwards button depending on the required sample flow direction. Click on the stop button to stop the sipper pump. When the flow-through cuvette is full click Close as a sample measurement cannot be performed when the accessory control is open. To operate in timed mode click on the Edit programs button.
pump direction is reversed by putting a tick in the box adjacent to reverse direction this will send the sample back to the sample container. When the required settings have been entered click on OK to save. Click on Cancel to return to the sipper pump accessory screen without saving any of the settings. In the Pre-Programmed section clicking on the sample button will make the instrument follow the parameters set under program 1.
Once the required temperature is reached click on the Close button to close the control. The peltier will remain at the set temperature until another temperature is entered. 12.4 Combined peltier and sipper pump The parameters for the combined peltier sipper pump must be entered separately in the peltier and sipper pump accessory controls. For more details refer to sections 12.2 and 12.3.