Genova Plus Spectrophotometer Operating Manual 736 505 REV A/11-12
Safety Please read this information carefully prior to installing or using this equipment. 1. The unit described in this manual is designed be operated only by trained personnel. Any adjustments, .maintenance and repair must be carried out as defined in this manual, by a person qualified to be aware of the hazards involved. 2. It is essential that both operating and service personnel employ a safe system of work, in addition to the detailed instructions specified in this manual. 3.
. Es ist jederzeit auf die sicherheitsrelevanten Daten sämtlicher verwendeter Chemikalien Bezug zu nehmen. Allgemein anerkannte Labormethoden zum sicheren Umgang mit Chemikalien sollten eingesetzt werden. 5. Besteht der Verdacht, dass die Sicherheitsvorrichtungen in irgendeiner Weise beschädigt wurden, muss das Gerät außer Betrieb genommen und gegen weiteren Gebrauch gesichert werden. Die Störung sollte der zuständigen Serviceeinrichtung unverzüglich gemeldet werden.
Contents Page Safety 1 SECTION 1 - Introduction 1.1 INSTRUMENT DESCRIPTION 1.2 INSTRUMENT SPECIFICATION 8 8 8 SECTION 2 – Installation 2.1 UNPACKING 2.2 INSTALLATION 2.3 DISPLAY 2.4 CONTROLS 2.5 REAR PANEL 2.6 FRONT PANEL 10 10 10 11 12 13 13 SECTION 3 – Theory and Practice of Spectroscopy Measurements 3.1 THEORY OF SPECTROSCOPY MEASUREMENT 3.2 NUCLEIC ACID DETERMINATION 3.3 SPECTROSCOPY MEASUREMENT 3.4 GOOD PRACTICE GUIDELINES 14 14 14 15 16 SECTION 4 – Instrument Setup 4.
.4 6.4.1 6.4.2 4 SAMPLE MEASUREMENT Measuring a Sample After Calibrating to a Standard Measuring a Sample After Calibrating to a Factor 28 28 29 SECTION 7 – Spectrum 7.1 MODE SPECIFIC PARAMETERS 7.2 METHOD SETUP 7.2.1 Scan Settings 7.2.1.1 Selecting Absorbance or % Transmittance 7.2.1.2 Setting Start and End Wavelengths 7.2.1.3 Setting the Scan Interval 7.2.1.4 Y-Axis Scaling 7.3 CALIBRATION 7.4 SAMPLE MEASUREMENT 7.5 DATA ANALYSIS 7.5.1 Peaks and Valleys Threshold 7.5.2 Peaks and Valleys Table 7.5.
SECTION 10 – MULTI-WAVELENGTH 10.1 MODE SPECIFIC PARAMETERS 10.2 METHOD SET UP 10.2.1 Multi-Wavelength Settings 10.2.1.1 Setting the Number of Wavelengths 10.2.1.2 Setting the Measurement Wavelengths 10.2.1.3 Changing the Resolution 10.2.1.4 Selecting Concentration Units 10.2.1.5 Setting the Concentration Calculation Equation and Factors 10.3 CALIBRATION 10.4 SAMPLE MEASUREMENT 51 51 51 52 52 52 52 52 53 53 53 LIFE SCIENCE MENU OPTIONS SECTION 11 – Concentration Plus 11.1 MODE SPECIFIC PARAMETERS 11.
6 SECTION 15 – PROTEIN 15.1 PROTEIN MENU OPTIONS 15.2 PIERCE 660 ASSAY 15.3 BCA ASSAY 15.4 BRADFORD ASSAY 15.5 LOWRY ASSAY 15.6 BIURET ASSAY 15.7 DIRECT UV 15.8 CALIBRATION AND SAMPLE MEASUREMENT 69 69 69 69 70 70 71 71 71 SECTION 16 – OD 600 16.1 MODE SPECIFIC PARAMETERS 16.2 METHOD SETUP 16.2.1 Selecting a Wavelength 16.2.2 Settings 16.2.2.1 Using a Standard 16.2.2.2 Using a Factor 16.2.2.3 Using an Instrument Factor 16.2.2.4 Setting the Dilution Factor 16.3 CALIBRATION 16.3.
18.2.3.1 18.2.3.2 18.2.3.3 18.2.3.4 18.3 18.3.1 18.3.1.1 18.3.2 18.3.3 18.3.3.1 18.3.3.2 18.3.4 18.4 Automatic 8 cell turret Peltier Sipper pump Combined sipper Peltier pump USING THE ACCESSORIES Automatic 8 cell turret Automatic 8 cell turret – supporting creation of a standard curve in quantitation Peltier Sipper pump Manual Sipper Pump Settings Timed Sipper Pump Settings Combined sipper Peltier SPARES 90 90 91 93 93 93 94 94 95 95 96 98 99 SECTION 19 – MAINTENANCE AND SERVICE 19.
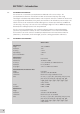
SECTION 1 - Introduction 1.1 INSTRUMENT DESCRIPTION The Genova Plus is a UV/visible spectrophotometer dedicated to life science analysis. This spectrophotometer allows the measurement of DNA concentrations and purity ratios using wavelengths recorded at 260, 280 and 230nm, with an optional correction at 320nm.The Genova Plus is pre-programmed with Bradford, Lowry, Biuret, BCA and Direct UV methods for protein analysis.
Curve fit algorithms Multi-wavelength Range Data points Calculations Kinetics Measurement Time Calibration Display Analysis Resolution Spectrum/Purity Scan Range Scan interval Analysis Multi-wavelength Plus Range Data points Calculations DNA Measurement modes Quadratic, quadratic through zero, linear, linear through zero, interpolate 0 to 9999 Up to 4 wavelengths Sum, product, ratio, difference 2 to 9999 seconds Blank with a single standard or factor Graphical and concentration Concentration, r
SECTION 2 – Installation 2.1 UNPACKING Remove the Genova Plus from the packaging and ensure the following items are included: 1. Model Genova Plus spectrophotometer fitted with micro-cuvette holder (736 501) 2. 24V 65W power supply unit (021 060) 3. Pack of 100 disposable UV micro-volume cuvettes 70μl (035 143) 4. 4GB USB memory stick (019 146) 5. Instruction manual (736 505) 6. Jenway Foreign Manual CD (JENMANCD) 7. 10x10mm single cuvette holder (630 204) 2.
The instrument will initially check for firmware updates (Section 20.3) and then perform several poweron tests before displaying the main menu: 1 3 2 4 5 Fig 2.2.2 – All Power On Tests Complete 1. Instrument check – ensures the validity of the saved parameters 2. Dark test 3. Checks for the accessory fitted. If an active accessory is found the instrument verifies communication and response 4. Self calibration of wavelengths 5. Checks communication between USB memory stick port and the instrument 2.
Life Science/Spectrophotometer menu options 1. Purity/Spectrum measurement mode 2. Concentration plus/Concentration measurement mode 3. Back key 4. Time and date toggle and settings 5. Multi-wavelength plus/Multi-wavelength measurement mode 6. Toggle between Life Science and Spectrophotometer modes 7. Protein/Photometrics measurement mode 8. Instrument settings menu 9. DNA/Quantitation measurement mode 10. OD 600/Kinetics measurement mode 2.
2.5 REAR PANEL The image below shows the rear panel on the instrument: 2.6 Fig. 2.5.1 – Rear Panel 1. Lamp access panel Allows access to lamp when replacement is necessary 2. Power switch On/off switch for the unit 3. Power in socket Connection socket for power supply unit 4. RS232 serial port Connection to a PC or external serial printer 5. Output sockets Analogue output FRONT PANEL The image below shows the front panel of the instrument: 1 5 2 4 3 Fig. 2.6.1 – Front Panel 1.
SECTION 3 – Theory and Practice of Spectroscopy Measurements 3.1 THEORY OF SPECTROSCOPY MEASUREMENT UV-visible spectroscopy is the measurement of the absorbance of light at a specific wavelength in a sample. This is used to identify the presence and concentration of molecular entities within the sample. The Beer-Lambert law is used to relate the absorption of light to the properties of the sample through which the light is travelling through.
Nucleic acid concentration can also be estimated with the following calculations: Conc (μg/ml) = (Abs@260nm x 62.9) - (Abs@280nm x 36.0) Conc (μg/ml) = (Abs@260nm x 49.1) - (Abs@230nm x 3.48) Referring to a blank value where no absorption should occur is commonly required. On the Genova Plus the default reference wavelength is 320nm and the user can include the measured absorbance value in all nucleic acid calculations. The default wavelength can be modified from 320nm if required. 3.
3.4 GOOD PRACTICE GUIDELINES 1. For optimum performance all spectrophotometers should be sited in a clean, dry, dust free atmosphere. When in use ambient temperature and light levels should remain as constant as possible. 2. If required adherence to Standard Operating Procedures (SOP) and Good Laboratory Practice (GLP) should be monitored with regular calibration checks and a suitable Quality Control (QC) programme. 3.
9. Deviations from the Beer-Lambert Law may occur at high and low concentrations giving non-linear response during sample concentration measurements. For all new methods a linear range should be defined by the preparation of a calibration curve. The quantitation mode may be used to construct such a curve against which sample results are automatically measured. 10. Cuvettes and sample holders must be filled to a minimum level which covers the light path.
SECTION 4 – Instrument Setup 4.1 NAVIGATING AND SCREEN SETUP The main life science menu screen is displayed below. Fig 4.1.1 – Life Science Home Screen Fig 4.1.
To navigate around the spectrophotometer screen press the soft keys adjacent to icons displayed on the screen. There is a back key which returns to the previous menu without saving any changes. The main menu screens provide access to all measurement modes, the time and date menu and the instrument settings menu. The measurement modes are specific to each of the instrument’s two home screens.
To change between the two formats press the key below the toggle icon. Once the current time and date have been set press the key adjacent to the tick icon to save the changes. To exit this menu without saving any changes press the back key and the screen will return to the main menu. 4.3 INSTRUMENT SETTINGS MENU The instrument settings menu is accessed by pressing the key below the instrument settings icon in the main menu.
methods can still be opened, deleted and saved but the method parameters cannot be changed. To enter the security code, use the keys at the bottom of the screen to select the digit to be changed. Use the keys adjacent to the arrow icons to increase or decrease the selected number. Once the correct security code has been entered press the key adjacent to the tick icon. The settings are now unlocked.
4.6 glp settings In addition to the time and date settings this instrument also has a user ID function. This function enables an individual three digit ID number to be set. This will be displayed on all printouts and saved results. The user ID function can be accessed through the instrument settings menu by pressing the key adjacent to the user ID icon. Use the keys at the bottom of the screen to select the digit to be changed. Use the keys adjacent to the arrow icons to increase or decrease the number.
SPECTROPHOTOMETER MENU OPTIONS SECTION 5 – Photometrics The photometrics measurement mode enables simple measurements of absorbance and % transmittance to be performed. The sample is measured at one wavelength and at one point in time. There are no post measurement calculations available in this measurement mode. 5.1 MODE SPECIFIC PARAMETERS The photometrics operating menu enables measurement parameters to be changed.
5.3 CALIBRATION The calibration must be performed at the same wavelength at which the sample will be measured. Insert a cuvette containing the blank solution into the sample chamber and close the instrument lid. Press the key below the calibrate to zero absorbance icon. This sets the instrument to zero absorbance and 100% transmittance. Once the calibration is complete the measure sample icon appears and the sample can be measured.
SECTION 6 – Concentration The concentration measurement mode enables simple measurements of absorbance and concentration to be performed. In this measurement mode it is possible to calibrate against a standard of a known concentration or use a known factor. The sample is measured at one wavelength at one point in time. There are no post measurement calculations available in this measurement mode. 6.
This will open a number entry screen. Use the keys at the bottom of the screen to select the digit to be adjusted. Use the keys adjacent to the arrow icons to increase or decrease the wavelength to the required number. Press the key adjacent to the tick icon to save the changes and return to the settings menu. 6.2.2 Settings The settings menu enables the wavelength, units, resolution, standard or factor to be set and is accessed from the operating menu by pressing the key adjacent to the settings icon.
6.2.2.3 Using a Standard The standard menu enables the value of a standard to be entered. This function is accessed by pressing the key adjacent to the standard icon. This opens the extended number entry screen. Use the keys at the bottom of the screen to select the digit to be changed. The key below the digits must be pressed twice to select the adjacent digit. For example 00 the first press of the key alters 10, the second press alters 01.
6.3.1 Calibrating to a Standard Insert a cuvette containing the blank solution into the sample chamber and close the instrument lid. Press the key below the calibrate to zero absorbance icon. The instrument will calibrate to zero absorbance. Insert a cuvette containing the standard concentration sample solution into the sample chamber and close the instrument lid.
6.4.2 Measuring a Sample After Calibrating to a Factor Remove the cuvette containing the blank solution and place a cuvette containing the sample to be measured in the sample chamber. Close the instrument lid and press the key below the measure to factor icon. Once the measurement is complete the concentration and absorbance values are displayed. In order to measure a sample based on a known factor the value for the factor must be entered in the settings menu before commencing measurement of the sample.
SECTION 7 – Spectrum The spectrum measurement mode enables measurements of absorbance or % transmittance over a range of wavelengths to be performed. The absorbance or % transmittance at each wavelength is plotted graphically. Post measurement tools such as peaks and valleys analysis and spectral points analysis can be performed. This operating mode can be used to partially characterise a sample. 7.1 MODE SPECIFIC PARAMETERS The spectrum operating menu enables measurement parameters to be changed.
7.2.1 Scan Settings This function enables the graph y-axis, absorbance or % transmittance operating mode, start and end wavelengths and scan interval to be set. To access this function press the key adjacent to the scan settings icon in the operating menu. Maximum Abs/% transmittance Tick icon Manual/automatic y-axis scaling Selecting Abs/% transmittance Minimum Abs/% transmittance Setting start wavelength Setting scan interval Setting end wavelength Fig 7.2.1.1 – Scan Settings Menu 7.2.1.
the start wavelength will automatically be set to be one times the scan interval. For example, if the end wavelength is entered as 500nm but the start wavelength is already set to 500nm and the scan interval is 2nm, the start wavelength will be automatically adjusted to 498nm. 7.2.1.3 Setting the Scan Interval This function enables the interval between wavelengths measured in the spectrum scan to be set. The scan interval can be altered to 1, 2 or 5nm by pressing the key below the scan interval icon.
7.3 CALIBRATION In the spectrum measurement mode the calibration is a baseline scan which is performed across the selected wavelength range at the selected scan interval. Insert a cuvette containing the blank solution into the sample chamber and close the instrument lid. Press the key below the baseline scan icon to initiate the baseline scan. The baseline icon will change to show baseline scan in progress icon and a progress bar will be displayed.
Depending on how many data points have been measured either a partial scan and all the post measurement tools will be displayed, or the instrument will return to the operating menu with no measurements saved. Once the scan is completed the spectrum will be shown on the screen. If automatic scaling was selected the y-axis will automatically be re-scaled. 7.5 DATA ANALYSIS The post measurement tools icons are displayed on the screen following the completion of the scan.
In the peaks and valleys table screen it is possible to display both peaks and valleys, just peaks or just valleys. To display the peaks only press the key below the peak only icon. To redisplay the peaks and valleys press the same key again. To display the valleys only press the key below the valley only icon. To redisplay the peaks and valley press the same key again.
or decrease the number. Once the wavelength has been entered press the key adjacent to the tick icon to save and return to the spectral points analysis menu. Secondly, the wavelength can also be entered manually in the spectral points analysis table by pressing the key adjacent to the location in the table where the result is to be stored. This opens a number entry screen where the analysis point can also be deleted by pressing the key adjacent to the delete icon.
SECTION 8 – Quantitation The quantitation measurement mode enables sample concentrations to be calculated using a standard curve. In this mode a number of standard solutions covering a range of known concentrations are measured at a set wavelength. The absorbance or % transmittance of these solutions is plotted to create a standard curve with replicate standards measurements, if required.
8.2.1 Quantitation Settings This function enables the absorbance or % transmittance operating mode, wavelength, units, resolution, number of replicate measurements (manual or automatic) and number of calibration standards to be set. To access this function press the key adjacent to the quantitation settings icon in the operating menu.
8.2.1.5 Selecting the Number of Replicate Standard Measurements The number of replicate measurements made for each standard that is used to construct the calibration curve is set by pressing the key next to the replicate measurements icon. The number of replicates can be set to 1 or 3. When 3 replicates measurements are made, the average reading is used to construct the calibration curve. If 1 is selected, no additional measurements are performed. 8.2.1.
This opens a number entry screen; use the keys at the bottom of the screen to select the digit to be changed, pressing the key twice to select the second digit. Use the keys adjacent to the arrow icons to increase or decrease the number. Once the required number has been entered press the key adjacent to the tick icon to save the changes. The photometric values of the standards can also be entered if known.
Remove the cuvette containing the blank solution from the sample chamber and insert the cuvette containing the first standardised solution to be measured. Close the instrument lid and press the key adjacent to the tick icon to take a reading of the standard. The concentration along with the photometric value will then be displayed. This standard can be re-measured by pressing the key adjacent to the back icon.
Repeat presses of the key cycles the curve fit between 1. Linear Regression Concentration = Abs x A + B 2. Linear Regression Through Zero Concentration = Abs x A 3. Quadratic Regression Concentration = A x Abs2 + B x Abs + C 4. Quadratic Regression Through Zero Concentration = A x Abs2 + B x Abs 5.
8.5 DATA ANALYSIS In quantitation the data analysis examines the statistics of the standard curve and algorithm of the curve fit. The curve statistics function is accessed by pressing the key below the S icon in the quantitation curve menu. The algorithm of the curve fit can be changed by pressing the key below the curve fit icon. For more information regarding curve fit and statistics refer to section 8.2.3.
SECTION 9 – Kinetics The kinetics measurement mode enables the absorbance or % transmittance of an active molecule to be measured over a period of time; for example enzyme analysis of horseradish peroxidase. The absorbance or % transmittance is measured at regular time intervals at a set wavelength over a period of time. The results are plotted on a graph to show the change in absorbance or % transmittance over time.
9.2.1 Kinetics Settings The settings menu enables the wavelength, units, resolution, graph y-axis, operating mode, standard, factor, measurement time, lag time and start on level to be set. Once all of the required settings have been entered press the key adjacent to the tick icon to save and return to the operating menu.
To change the maximum absorbance or % transmittance value press the key adjacent to the maximum y-axis value and this opens a number entry screen. Use the keys adjacent to the arrow icons to increase or decrease the number. To change the sign press the key below the + or icon. Repeat presses will cycle between + and –. Once the required absorbance or % transmittance has been entered press the key adjacent to the tick icon. 9.2.1.
9.2.1.5 Selecting Concentration Units The concentration units can be selected from a number of options: no units, %, ppm, EBC, SRM, mEq/l, mEq, M, mM, µM, nM, U, U/l, U/ml, g/l, mg/l, µg/l, ng/l, g/dl, mg/dl, µg/dl, mg/ml, µg/ml, ng/ml, µg/µl, ng/µl, mol/l, mmol/l. In the settings menu press the key below the units icon to open the unit selection screen which displays all the different unit options. Use the keys adjacent to the arrow icons to navigate around the screen to select the required units.
9.2.1.8 Selecting a Wavelength To adjust the wavelength press the key adjacent to the wavelength icon. This will open the number entry screen. Use the keys at the bottom of the screen to select the digit to be changed, pressing the key twice to select the second digit. The keys adjacent to the arrow icons can be used to increase or decrease the number. Once the required wavelength has been entered press the key adjacent to the tick icon to save the changes and return to the settings menu screen. 9.2.1.
If a start on level has been set the Abs/%T icon is displayed in the centre of the screen. The instrument will take photometric readings until the start on level is reached. Once the absorbance/% transmittance level has been reached the readings will be plotted on the graph. Once the measurement has commenced it can be aborted by pressing the key below the kinetics measurement in progress icon.
specifically. This function can be accessed from the statistics menu or from the operating menu by pressing the key adjacent to the kinetics moving line icon. In the kinetics moving line screen the initial and final time lines appear as two vertical lines. The line which is selected is represented by a dashed line ---- and can be moved using the keys below the greater than (>) or less than (<) icons at the bottom of the screen.
SECTION 10 – Multi-wavelength The multi-wavelength measurement mode allows the user to measure a sample’s photometric absorbance or %transmittance at two, three or four wavelengths. The mode allows the user to select from a number of pre-set equations to add, subtract, multiply or divide the photometric readings. Following sample measurement, the photometric readings and the selected equation’s result are displayed on the operating menu screen. 10.
10.2.1 Multi-Wavelength Settings The settings menu enables the wavelengths, number of wavelengths, units, resolution, concentration calculation equation and concentration equation factors to be set. Once all of the required settings have been entered press the key adjacent to the tick icon to save and return to the operating menu.
10.2.1.5 Setting the Concentration Calculation Equation and Factors In the settings menu press the key adjacent to the concentration calculation/factors icon. This screen allows the user to select the required concentration calculation equation from the following list of options. 1. ∑ = ((xF1*l1) + (x F2*l2))*xF3 2. ∑ = ((xF1*l1) - (x F2*l2))*xF3 3. ∑ = ((xF1*l1) * (x F2*l2))*xF3 4.
LIFE SCIENCE MENU OPTIONS SECTION 11 – Concentration Plus The concentration plus measurement mode enables simple measurements of absorbance, %transmittance and concentration to be performed. In this measurement mode it is possible to calibrate against a standard of a known concentration or use a known factor. The sample is measured at one wavelength at one point in time. There are no post measurement calculations available in this measurement mode. 11.
11.2.2 Concentration Plus Settings The concentration plus settings menu enables the wavelength, units, resolution, standard, factor and dilution factor to be set and is accessed from the operating menu by pressing the key adjacent to the settings icon. Once all of the required settings have been entered press the key adjacent to the tick icon to save and return to the operating menu.
In the settings menu press the key below the units icon. This opens the unit selection screen which displays all the different units. Use the keys adjacent to the arrow icons to navigate around the screen to select the required units. Once the required units have been highlighted press the key adjacent to the tick icon to save and return to the settings menu. The selected unit will be displayed in the operating menu along with absorbance and selected wavelength. 11.2.2.
11.2.2.6 Setting the Dilution Factor In the settings menu press the key adjacent the dilution icon. This screen allows the user to input the relative sample and diluent volumes which have been used to prepare the sample being measured. Using this information, the instrument calculates a dilution factor which allows the instrument to determine and display the concentration of the original undiluted sample. The volume of sample is entered by pressing the key adjacent to the sample volume icon.
Insert a cuvette containing the standard concentration sample solution into the sample chamber and close the instrument lid. Press the key below the calibrate to zero absorbance or standard icon, this will open another menu with the option to re-calibrate to zero absorbance or to calibrate to the previously entered standard value. Press the key adjacent to the calibrate to standard icon. If the standard selected requires a factor beyond the range of the instrument the check standard icon will be displayed.
11.4.2 Measuring a Sample After Calibrating to a Factor Remove the cuvette containing the blank solution and place a cuvette containing the sample to be measured in the sample chamber. Close the instrument lid and press the key below the measure to factor icon. Once the measurement is complete the concentration and absorbance values are displayed. In order to measure a sample based on a known factor the value for the factor must be entered in the settings menu before commencing measurement of the sample.
SECTION 12 – Purity Scan The purity scan measurement mode enables measurements of absorbance or % transmittance over a range of wavelengths to be performed. The absorbance or % transmittance at each wavelength is plotted graphically. Post measurement tools such as peaks and valleys analysis and spectral points analysis can be performed. This operating mode can be used to check the peak purity of a nucleic acid sample. This measurement mode’s setup and operations are described in Section 7 of this manual.
SECTION 13 – Multi-wavelength plus The multi-wavelength plus measurement mode allows the user to determine the concentration of a sample using photometric readings at more than one wavelength. The mode will also show the ratio of two readings; a reading that is commonly used to indicate the purity nucleic acids. The mode includes an option to include a reference wavelength measurement in the available calculations.
13.2.1 Multi-wavelength Plus Settings The settings menu enables the wavelengths, number of wavelengths, units, resolution, dilution factor, concentration calculation equation and concentration equation factors to be set. Once all of the required settings have been entered press the key adjacent to the tick icon to save and return to the operating menu.
13.2.1.4 Setting the Dilution Factor In the settings menu press the key below the dilution icon. This screen allows the user to input the relative sample and diluent volumes which have been used to prepare the sample being measured. Using this information, the instrument calculates a dilution factor which allows the instrument to determine and display the concentration of the original undiluted sample. The volume of sample is entered by pressing the key adjacent to the sample volume icon.
When a reference wavelength is included these equations are modified as follows: 1. ∑ = xF1*(l1-l4) 2. ∑ = (xF1*(l1-l4)) - (xF2*l2) Repeat presses will cycle through the options available. The concentration equation factors can be edited by pressing the key adjacent to the concentration factor icons. This opens the extended number entry screen. Use the keys at the bottom of the screen to select the digit to be changed. The key below the digits must be pressed twice to select the adjacent digit.
SECTION 14 – DNA The DNA measurement mode allows the user to select a method from a list of common nucleic acid measurement tests, including single wavelength concentration measurements for dsDNA, ssDNA, RNA and Oligonucleotides and methods that use absorbance ratios for estimating nucleic acid purity, such as 260nm/280nm and 260nm/230nm. 14.
The ssDNA settings menu allows the user to adjust measurement specific parameters such as the dilution factor and resolution. Other method settings can be altered if required, but the concentration units are limited to μg/ml and mg/ml only. The ssDNA method settings are locked and any changes will be lost after exiting the mode. See Section 11 for full instructions on altering the ssDNA menu options and settings. 14.
14.6 260 / 280 The 260/280 operating menu enables the purity and concentration of DNA to be estimated according to the following equations:Purity Ratio = Abs@260nm / Abs@280nm Conc (μg/ml) = (Abs@260nm x 62.9) - (Abs@280nm x 36.0) Operating Menu The 260/280 settings menu allows the user to adjust measurement specific parameters such as the dilution factor and resolution but the concentration units are limited to μg/ml and mg/ml only.
The Variable Ratio settings menu allows the user to adjust measurement specific parameters such as the dilution factor and resolution but the concentration units are limited to μg/ml and mg/ml only. Other method settings, such as the inclusion of a reference wavelength and the concentration equation and factors are altered by following the instructions given in Section 13. The updated method can be saved for future use by following the instructions given in Section 17. 14.
SECTION 15 – Protein The protein measurement mode allows the user to select a method from a list of common protein assays, including Pierce 660, BCA, Bradford, Lowry, Biuret and Direct UV 15.1 PROTEIN MENU OPTIONS Menu Options 15.2 The protein menu allows the user to select the required pre-defined method from the list of on-screen options by pressing the key adjacent to the measurement method that is required.
The BCA settings menu allows the user to adjust measurement specific parameters such as the number of standards and result resolution. Other method settings can be altered if required, but the BCA method settings are locked and any changes will be lost after exiting the mode. See Section 8 for full instructions on altering the BCA menu options, settings and creating a new standard curve. 15.
15.6 BIURET ASSAY The Biuret operating menu enables the user to perform the Biuret protein assay at the specified wavelength of 540nm. Operating Menu The Biuret settings menu allows the user to adjust measurement specific parameters such as the number of standards and result resolution. Other method settings can be altered if required, but the Biuret method settings are locked and any changes will be lost after exiting the mode.
SECTION 16 – OD 600 The OD 600 measurement mode enables optical density measurements of cell cultures and broths to be performed. In this measurement mode it is possible to use a known factor to estimate the number of cells or the user can determine the factor to be used by measuring a standard solution containing a predetermined number of cells. An instrument normalisation factor can also be applied to equate the results obtained on different spectrophotometers.
The settings menu is accessed through the operating menu by pressing the key adjacent to the settings icon. In the settings menu press the key below the wavelength icon. This will open a number entry screen. Use the keys at the bottom of the screen to select the digit to be adjusted. Use the keys adjacent to the arrow icons to increase or decrease the wavelength to the required number. Press the key adjacent to the tick icon to save the changes and return to the settings menu. 16.2.
9.999e+19 can be entered. The standard value can be reset to 1.000e+00 by pressing the key adjacent to the 001 icon. Once the standard value has been entered press the key adjacent to the tick icon to save and return to the settings menu. The entered value is displayed in the settings menu adjacent to the standard icon. A standard value should only be entered if the factor is not known. If the factor is known the standard value should be set to 1.000e+00. 16.2.2.
16.2.2.4 Setting the Dilution Factor In the settings menu press the key adjacent the dilution icon. This screen allows the user to input the relative sample and diluent volumes which have been used to prepare the sample being measured. Using this information, the instrument calculates a dilution factor which allows the instrument to determine and display the concentration of the original undiluted sample. The volume of sample is entered by pressing the key adjacent to the sample volume icon.
16.3.1 Calibrating to a Standard Insert a cuvette containing the blank solution into the sample chamber and close the instrument lid. Press the key below the calibrate to zero absorbance icon. The instrument will calibrate to zero absorbance. Insert a cuvette containing the standard concentration sample solution into the sample chamber and close the instrument lid.
16.4.2 Measuring a Sample After Calibrating to a Factor Remove the cuvette containing the blank solution and place a cuvette containing the sample to be measured in the sample chamber. Close the instrument lid and press the key below the measure to factor icon. Once the measurement is complete the concentration and absorbance values are displayed. In order to measure a sample based on a known factor the value for the factor must be entered in the settings menu before commencing measurement of the sample.
SECTION 17 – Saving, printing and autologging The utility toolbar in the operating menu provides access to printing, print setup options, opening, saving and deleting results and methods and autologging options. If the method lock has been activated the method selection menu is disabled. Print/print settings Results selection menu Method selection menu Autolog menu Fig 17.1 - Operating Menu 17.
The default method name will be displayed. To save the method under the default name press the key adjacent to the tick icon. To change the name of the method press the key below the eraser icon. One press of the key will delete one letter, holding the key for 2 seconds will delete the name completely. To select letters use the keys adjacent to the arrow icons to move around the menu. Once the required letter is highlighted press the key below the pencil icon to select the letter.
17.2 OPENING METHODS Methods can be opened from the internal memory of the instrument or from a USB memory stick. Before a method can be opened from a USB memory stick it must be saved to the internal memory of the instrument first. 17.2.1 Opening Methods From Internal Memory In the operating menu press the key adjacent to the method icon to open the method selection menu and use the keys below the arrow icons to move page up or down.
17.3 DELETING METHODS In the operating menu press the key adjacent to the method icon to open the method selection menu and use the keys adjacent to the arrow icons to move page up or down. Select the method to be deleted by pressing the key adjacent to the method location and press the key below the delete icon. Confirmation will be needed to delete the selected method; press the key adjacent to the tick icon to confirm deletion.
The saved results are listed alphabetically with the date and time that the result was generated. If there is already a result saved under the same name confirmation will be needed to replace the existing result with the new one. Press the key adjacent to the tick icon to confirm replacement. Press the key adjacent to the cross icon to cancel and return to the results naming menu.
17.6 DELETING RESULTS Results can only be deleted if a valid USB memory stick is inserted into the front of the instrument. In the operating menu press the key adjacent to the USB memory stick icon to open the results selection menu. Select the result to be deleted by pressing the key adjacent to the result. Press the key below the delete icon. Confirmation will be needed to delete the selected result; press the key adjacent to the tick icon to confirm deletion.
Once the required printout destination and language has been selected press the key adjacent to the tick icon to save and return to the operating menu. 17.7.1.1 Print Setup – PHOTOMETRICS, CONCENTRATION, MULTIWAVELENGTH AND OD 600 In the photometrics, concentration, multiwavelength and OD 600 measurement modes the print setup menu does not contain any additional post analysis statistics. 17.7.1.
icon. Repeat presses of the key will cycle between a tick and a cross icon for selected or deselected. To select the data interval press the key adjacent to the data interval icon. Repeat presses will cycle between 0, 1, 5, 10, 30 or 60 seconds. Once the required options have been selected press the key adjacent to the tick icon to save and exit print setup. 17.7.2 Printing Results Results displayed in the operating menu can be printed by pressing the key adjacent to the printer icon.
Once the number of repetitions is increased above zero, if the results are autologged to a USB memory stick, the batch ABC icon will be displayed. To assign a batch name for the repeated measurements press the key below the batch ABC icon to open the batch naming menu. The default batch name will be displayed. To save the batch name under the default name press the key adjacent to the tick icon. To change the name, press the key below the eraser icon.
the results that are going to be recorded. Press the key adjacent to the tick icon to confirm selection. Press the key adjacent to the cross icon to cancel and return to the operating menu. 17.8.2 Selecting Result’s Destination The autolog menu enables the result’s destination to be set. To select the internal printer press the key adjacent to the printer icon. This option is only available if an internal printer is connected.
SECTION 18 – Accessories and spare parts 18.1 18.
Squeeze the grey plastic clips together so that the printer top opens. Slot the printer into the top of the instrument and push down until it fits flush to all four sides. Insert the paper roll into the printer – ensuring that there is some paper sticking out of the printer before clicking the grey plastic back into place. Switch the instrument on. The power and error lights on the printer will flash.
This will expose the bottom of the sample chamber with the power supply connection needed to operate the active accessories. 18.2.3.1 Automatic 8 cell turret Take the 8 cell turret base plate. Connect the power supply in the bottom of the sample chamber to the connector on the underside of the base plate. Place the base plate in the sample chamber. Replace screws 1 to 4.
When the accessory is fitted the instrument will look like this. 18.2.3.3 Sipper pump For this accessory as well as removing the passive accessory base plate, the front panel of the instrument must also be removed. Loosen screws 5 and 6 until the front panel can be lifted out in the forwards direction. 5 6 Take the sipper base plate. Connect the power supply in the bottom of the sample chamber to the connector on the underside of the base plate. Place the base plate in the sample chamber.
For sipping: 1. Connect the sipper pump tubing to the outlet port on the flow-through cuvette. 2. Secure the tubing using the clip on the righthand side of the pump head. 3. Ease the tubing round the rollers by carefully rotating them clockwise, by hand. Clamp the tubing into the clip on the left hand side of the motor. 4. Once secured, ensure the tubing is routed into the two retaining clips located on the base plate at the side of the pump head. 5.
6. Connect a suitable length of sipper pump tubing to the external outlet port. 7. Insert one end of the capillary tube into the sipper pump tubing, as shown. 8. Feed the other end through the inlet port located on the inside of the bulkhead. 9. Fit the sipper probe and secure using the thumbscrew. 10. Carefully feed the tubing through the sipper probe, allowing sufficient length for it to pass into a suitable receptacle.
Press the key below the 8 cell turret icon to highlight the icon and the two arrow icons above. Press the keys adjacent to the arrow icons to increase or decrease the current cell position of the turret, until the required sample position has been selected. Press the key below the measure sample icon. The instrument will perform a reading and display the result on the screen. To measure the next sample select the next turret position and press the key below the measure sample icon.
This opens the Peltier settings screen. Use the keys at the bottom of the screen to select the digit to be changed and use the arrow icons to increase or decrease the number. The temperature can be set in °C or °F by pressing the key adjacent to the °C icon. Repeat presses will cycle between °C and °F. Once the required temperature has been selected press the key adjacent to the tick icon to save and return to the operating menu. The Peltier will begin to heat or cool depending on the current temperature.
Confirmation will be needed to start the sipper pump. Press the key adjacent to the tick icon to confirm and start the sipper pump. Press the key adjacent to the cross icon to cancel and return to the expanded operating menu. To stop the sipper pump press the key adjacent to the stop icon. Ensure that the flow through cuvette contains enough sample before pressing the key below the measure sample icon. 18.3.3.
To fine tune the amount of sample uptake press the key below the plus or minus icon to increase or decrease the amount of sample taken up. The recorded time will be adjusted accordingly. Once the fine tuning is complete, or if none is required, press the key adjacent to the tick icon to move to the next stage of the calibration sequence. This stage allows an air gap to be added to the calibration sequence. If an air gap is not required press the key below the 000 icon to set the air gap to zero.
To perform a measurement place the sipper tubing into the sample and press the key below the sipper pump icon. Confirmation will be needed to start the sipper pump. Press the key adjacent to the cross icon to cancel and return to the operating menu. Press the key adjacent to the tick icon to confirm and start the sipper pump. The pump will run for the previously recorded sample take up time. Ensure that the flow through cuvette contains enough sample before pressing the key below the measure sample icon.
The settings menu is the same as the sipper pump settings except for the Peltier icon in the top left hand corner. Pressing the key adjacent to the Peltier icon will open the Peltier settings enabling the temperature to be set. Refer to section 18.3.2 for more details. The sipper pump can operate in a manual or timed mode. Refer to section 18.3.3 for more details. 18.
SECTION 19 – Maintenance and service 19.1 ROUTINE MAINTENANCE Ensure the external surfaces of the unit are clean and free from dust. The sample area should always be kept clean and any accidental spillage should be wiped away immediately. To give added protection when not in use, the unit should be disconnected from the mains supply and covered with the optional dust cover. 19.2 LAMP REPLACEMENT 19.2.1 Xenon Lamp Module Replacement This must be done by an accredited service engineer.
SECTION 20 – Troubleshooting 20.1 ERROR CODES If an error code is displayed it will be accompanied by a spanner icon and a symbol to indicate if the error is a warning (caution icon) or fatal (stop icon). If the error is fatal contact your local distributor or Jenway service department (refer to section 19.4). If the error is a warning it may be possible to retry the test. In this case a back icon will also be displayed.
Err 4 Microswitch Failure (service only) Fatal This error indicates that the microswitch was not found. The most likely causes of this error are: 1. The microswitch is broken. Solution: Contact a service technician. Err 5 Light Saturation Not Found Warning Err 7 USB Module Failure Warning Err 8 This error indicates the instrument is unable to detect a response from the UBS module. The most likely causes of this error are: 1. USB port failure.
20.2 20.3 TOUBLESHOOTING GUIDE Issue Solution Unable to achieve zero absorbance or 100% transmittance when calibrating Ensure that there is not a sample in the sample chamber. Ensure the instrument lid is closed before and during the calibration. Ensure the lamp is working – if the lamp has failed please request service assistance. Unable to achieve a reading when measuring a sample Ensure the correct cuvette is being used so that light isn’t being absorbed by the cuvette.
SECTION 21 – Declaration of Conformity 104
SECTION 22 – Glossary of icons Mode ICON Description Common Back key Common Tick icon - Done/yes Common Cross icon – Cancel/no Common Printer icon - Print/open printer settings Common No results to send to printer Common Computer icon - RS232 serial port for connection to an external serial printer or a computer Common No results to send to RS232 Common English icon - Language selection English Common USB memory stick Common Save to USB memory stick Common Load
Common Eraser icon - Delete letter/number Common AB icon - Change letter case/number Common Delete Common Method icon – opens method selection screen Common Save method/result Common Open method/result Common 106 ---- Units icon – opens unit selection screen Common Resolution Common Wavelength 400nm Common ABS/%T Abs/%T icon - Operating mode either absorbance or % transmittance Common Caution icon – accompanied by error code Common Check number Common St
Main Menu 12.
Concentration Calibrate to zero absorbance or standard Concentration Factor menu Concentration Standard menu Concentration 108 001 Resets value to one Concentration Check standard Spectrum Scan settings menu Spectrum Hand icon – Manual y-axis scaling Spectrum Hand icon with cross through it - Auto y-axis scaling Spectrum Scan interval Spectrum Baseline scan Spectrum Baseline scan in progress Spectrum Scan sample Spectrum Sample scan in progress Spectrum
Quantitation Number of standards Quantitation View standard curve Quantitation Curve fit – enables the curve fit to be adjusted Quantitation Sigma icon – Displays curve statistics Quantitation Measure standards Quantitation Replicate measurement selection Quantitation Tick icon - Read Standard Quantitation Back icon – Re-measure previous standard Quantitation Cross icon – Cancel creation of new standard curve Quantitation Curve statistics – used in print setup Quantit
110 Kinetics Double greater than icon - Increase the time by 5 seconds intervals Kinetics Single greater than icon - Increase the time by 1 second intervals Kinetics Data point interval – used in print settings Multi-wavelength Settings menu Multi-wavelength Calculation factors menu Multi-wavelength Calculation factor entry Multi-wavelength Calculation equation selection Multi-wavelength Update measurement wavelength Multi-wavelength Select number of mea
Accessories No single cell - Method created on a unit with a single cell accessory fitted Accessories 8 cell turret icon - the automatic 8 cell turret is in use Accessories Error finding cell position 0 on turret Accessories No turret - Method created on a unit with a turret accessory fitted Accessories Accessories °C °F Degrees Celsius Degrees Fahrenheit Accessories Peltier accessory in use – current temperature is below set point.
UK North & South America Middle East Bibby Scientific Ltd. Beacon Road, Stone Staffordshire ST15 0SA United Kingdom Tel: +44 (0)1785 812121 Fax: +44 (0)1785 810405 e-mail: sales@bibby-scientific.com www.bibby-scientific.com Bibby Scientific US Inc. t/a Techne Inc. 3 Terri Lane, Suite 10 Burlington, NJ 08016 USA Toll Free (in NA): 800-225-9243 Tel: +1 609 589 2560 Fax: +1 609-589-2571 e-mail: labproducts@techneusa.com www.techneusa.com Bibby Scientific Middle East Ltd.