
- Power Measurement Modem User's Guide


ION 7500 / ION 7600 User’s Guide Displaying Data with Vista
Chapter 4 - Using ION Software Page 97
◆ Real-time voltage flicker severity data for short term (Pst) and Long term (Plt)
observation periods. Plt values > 0.65, or Pst values >= 1.0 indicate that the level
of flicker is likely to be irritable (refer to the description of the Ficker module in
the online ION Programmer’s Reference for more details). (ION 7600 only)
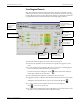
This diagram also includes control objects for triggering manual waveform
recording, enabling/disabling sag/swell and transient (if applicable) event
recording, enabling/disabling harmonics logging, and resetting the Voltage
Disturbance Counter.
Harmonics Trending
◆ The Log Server must be running to view the logged harmonics data.
◆ Harmonics data logging is enabled by default.
◆ The control object indicates the logging enable status: the switch is in the up
position (1) when logging is enabled, and down (0) when logging is disabled.
Long-Term Harmonics Min/Max Measurements
Click the Long-term Min/Max object in the Power Quality Diagram to view the
Long-Term Harmonics Min/Max Measurements window. It shows min/max
values for phase voltage and current THD.
Min/max values can be reset with the Harmonics Min/Max Reset Object. All min/
max values are valid from the time the last reset was performed.
EN50160 Measurements (ION 7600 only)
Click on the EN50160 tab of the Power Quality diagram to view a comprehensive
display of EN50160 statistics and parameters. Each tab in the EN50160 display
corresponds to an EN50160 voltage measurement component (Frequency,
Magnitude, Interruptions, Dips, Overvoltages, Flicker, Unbalance, Harmonics,
Interharmonics, and Mains Signalling).
Refer to the technical note Power Quality: ION Meters and EN50160 for more
information.
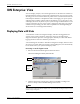
Revenue Measurements
The Revenue Measurements diagram shows instantaneous power, energy and
demand measurements. It also provides access to an Energy & Demand by
Quadrant screen, and a number of interactive setups and controls.
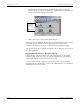
Instantaneous Power
This section of the window depicts instantaneous active power, reactive power,
and apparent power against a four-quadrant display.
Energy & Demand
This section shows Sliding window and thermal demand for the active, reactive,
and apparent power (delivered and received). Accumulated values of active,
reactive, and apparent energy (delivered and received) are also provided.