
Operation Manual


Function Keys
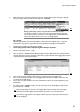
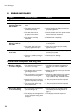
Graph
This is a graphic overview of the training information (fig.36). The horizontal axis shows the
distance. You can select the data you want to appear in the graph by clicking on SPEED,
POWER, CADANCE AND HEARTRATE. The upper and lower limits of the heartrate will be
indicated with a dotted horizontal line. The bar graph shows the structure of the training pro-
gram. It shows the number of selected routes, the unit and value settings. At the bottom of the
graph you will find data about the cyclist and his or her score.
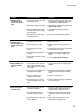
Calendar Opens the month selected. The figures in green indicate that there is training
information in the PC for the day in question. On days for which no training
information has been recorded, the figures will be in black. In the two scroll
windows at the top left, you can select MONTH and YEAR. Click on the
TODAY button to return to the current day.
< > Browse quickly forward and backward through the days for which scores have
been recorded. Days without records will be skipped. Your PC arrow keys can
perform the same functions.
Last Ride The last ride appears in the list of options.
Search Opens a search window. Using the DATE RANGE button, you can select the
starting and end dates, determine the ranking of the rides, select a name, pro-
gram type, date, cycling time, distance and finishing time. After double clicking
on the selected ride, you will return to the day report.
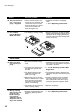
Notes
You can enter personal notes for each ride. The maximum number of characters is 255. Select
SENSE from the five different sensory conditions or describe it in your own words in 20 charac-
ters or less. For TEMPERATURE, you should enter the degrees in Celsius or Fahrenheit in the
space where you trained.
Training Information
A brief summary of the training information relating to the selected ride will appear at the right
of the day report. This will entail information such as ID data, speed, power, cadence and heart
rate.
29
GB
Excel Analyser Software
36