
Operation Manual


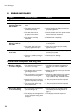

Table
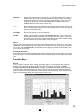
The table provides the most detailed information. It is an overview of data recorded per 5 or
10 seconds the runs (fig.37). You can copy all data in the tables via the TO CLIPBOARD for use
in other software programs.
Overlap
With this function you can compare two graphs or overviews. Select a ride from the daily
report and click on the OVERLAP button. A window will open with all the trips with the same
program settings. After making a selection, click on GRAPH and compare the two overlapping
graphs that appear. The last-selected score will appear in dotted lines.
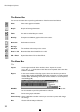
Overview
The performance overview is a summary of the table. The left?hand column shows the structu-
re of the program per route. With the SPEED, WATTS, CADENCE and/or PULSE RATE but-
tons, you can select the information you want to see. The length of the list will depend on the
number of program routes established.
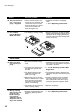
Excel > PC
Download data from Grand Excel to the PC.
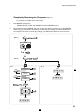
1 Follow the sequence of instructions entitled
> Connecting up Grand Excel and Running the Excel Analyser Software.
2 After clicking on the EXCEL > PC button, the communication window with Excel will appear
with the text Downloading .... Simultaneously, you will see a progress report of the memory
transfer.
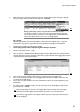
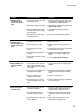
Viewing the Graph
With the arrow keys on the keyboard you can relocate the vertical MARKING LINE. The values
at the bottom left of the graph correspond to the position of the marking line. The slope value,
power, or heart rate is also given.
You can also view sections of the graph in detail using ZOOM. Use the mouse to select the
section you wish to enlarge. After zooming in, a scroll bar will appear at the bottom of the
graph. The data in statistics will change accordingly. Right-click with the mouse on FULL VIEW
to cancel the selection. To set minimum, average and maximum performance values and to view
energy consumption (KCal of KJoule), select STATISTICS. With PROGRAM, you can turn off the
coloured bar. To enhance the quality of the black-and-white letters, you can use the SYMBOLES
function to mark the curves in the graph. The NOTES function shows the text entered in the
daily report.
The red coloured text
gives the program per
route with unit and
value settings.
30
GB
Excel Analyser Software
37