
Owner's manual


REV 2 CT-7500 S2 USER’S MANUAL
iv
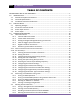
LIST OF FIGURES
Figure 1. CT-7500 S2 Controls and Indicators ................................................................................. 6
Figure 2. CT-7500 S2 Operating Voltage Setting Switch ................................................................. 8
Figure 3. Typical 3-Phase Circuit Breaker Connections ................................................................ 10
Figure 4. Typical Connections for Series Contact Circuit Breaker ................................................ 11
Figure 5. Typical DC Trip and DC Close Control Circuit Connection ............................................. 12
Figure 6. Typical DC Trip and AC Close Control Circuit Connection .............................................. 13
Figure 7. Typical Analog and Digital Voltage Monitoring Connections ........................................ 14
Figure 8. Typical External Trigger Input Cable Connections ......................................................... 15
Figure 9. Typical Digital Transducer Connection .......................................................................... 16
Figure 10. Typical Resistor Type Transducer Connection ............................................................. 17
Figure 11. AC Current Sensor Connection .................................................................................... 18
Figure 12. Typical 50 Hz Tabulated Test Results ........................................................................... 31
Figure 13. Typical 60 Hz Tabulated Test Results ........................................................................... 31
Figure 14. Contact Filter Setting Illustrations ............................................................................... 35
Figure 15. Sample Resistor Type Transducer Setup Directory ..................................................... 45
Figure 16. Sample Timing Report Using a Resistor Type Transducer ........................................... 46
Figure 17. Typical O-C-O Test Results Graph ................................................................................ 56
Figure 18. Typical Tabulated Test Results Printout for an O-C-O Operation ................................ 57
Figure 19. Typical Initiate and Trigger Connections for Operating Two CT-7500 S2's in Tandem 58
Figure 20. Typical Tabulated Test Results Printout for a CLOSE Operation ................................. 61
Figure 21. Typical Test Results Graph (CB CLOSE Test) ................................................................ 63
Figure 22. Expansion Graph from 0ms to 300ms (CB CLOSE Test) ............................................... 64
Figure 23. Typical O-C-O Test Results Graph ................................................................................ 65
Figure 24. Typical Tabulated Test Results Printout for an O-C-O Operation ................................ 66
Figure 25. Graphical Interpretation of an OPEN Timing Shot ....................................................... 67
Figure 26. Graphical Interpretation of a CLOSE Timing Shot ........................................................ 67
Figure 27. Graphical Interpretations of an OPEN-CLOSE and CLOSE-OPEN Timing Shot ............. 68
Figure 28. Sample Test Record Directory Printout ....................................................................... 71
Figure 29. Typical Test Results Printout with Pass/Fail Indicators ............................................... 79
Figure 30. Typical Test Plan Directory Printout ............................................................................ 81
Figure 31. Typical Breaker Test Plan Printout ............................................................................... 8 3
Figure 32. Siemens SPS2 121 CLOSE Timing Illustration ............................................................... 84
Figure 33. Siemens SPS2 121 OPEN Timing Illustration ................................................................ 85
Figure 34. Typical Slow-Close Test Results Printout ..................................................................... 87
Figure 35. Partial Data Points Printout ......................................................................................... 91