GEIGER COUNTER "Gamma Check Pro" OPERATING INSTRUCTIONS FOR THE SOFTWARE Item no.
TABLE OF CONTENTS Page 1. Functions of the Software............................................................................................................................................................................. 3 2. Software/Driver Installation.......................................................................................................................................................................... 3 3. First Steps...................................................................
1.
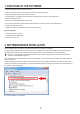
3. GETTING STARTED At the first start of the software, the COM port of the Geiger counter "Gamma Check Pro" must be selected according to the entry in the device manager (in this example: "COM7"). This setting can be changed later under "Settings->COM-Port".
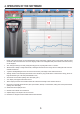
4. OPERATION OF THE SOFTWARE 1 Display of the measured values: Can be switched between current measurement, maximum values, average values of the last 24 hours and results of the last measurements. The current charging condition of the rechargeable battery and association of the device memory are also displayed. 2 "File": Saving and loading of recorded, printing measuring protocols, exporting data to Excel or ".
General Notes: • The export functions for "Excel" and ".CSV" refer only to the currently selected record. • The charts are printed out as shown on the screen. I.e. when one section has been enlarged, this enlarged view is issued as well. Insertion of a title line with indication of the number of recording, start time and mode are performed automatically. The recommended print format is DIN A4 or DIN A3.
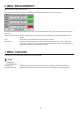
6. MENU "MEASUREMENTS" Measurements can be started and ended here. The corresponding input field can be reached in "Measurements->Start/Stop Measurements" or by quick access field. The three measurement dosimeter/counter/pulse rate can be configured individually. After clocking "OK", the set parameters are transferred to the device. Duration of the measurement Selection of "Endless" leads to an endless measurement. Alternatively, a temporary measurement can be selected.
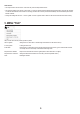
. MENU "SETTINGS" Various settings can be made here.
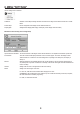
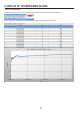
. DISPLAY OF THE MEASURED VALUES Selection of the measurement After the device memory has been read ("Log-Data->Download Logs"), the desired measurement can be selected. Then the selected measuring series is loaded into the table and chart illustration and may be evaluated.
Using the Windows clipboard In addition to the export functions, there also is the option of exporting the recorded data into any spreadsheet programs, such as "Excel" or "LibreOffice Calc/OpenOffice Calc" via the Windows clipboard. Procedure: 1. Select the desired lines in the table. 2. Right-clicking the table will bring up a selection option (see figure on the right).
10. OPERATION OF THE CHART FUNCTION Enlarging to specific areas "Zoom" by mouse: Keep the left mouse button pushed in the graphical view and pull a frame over the desired area. After releasing the mouse button, the display will be enlarged to the selected area. Alternatively: • Right-clicking in the area of the chart will bring up a selection option (see figure on the right).
Legal Notice This is a publication by Conrad Electronic SE, Klaus-Conrad-Str. 1, D-92240 Hirschau (www.conrad.com). All rights including translation reserved. Reproduction by any method, e.g. photocopy, microfilming, or the capture in electronic data processing systems require the prior written approval by the editor. Reprinting, also in part, is prohibited. This publication represent the technical status at the time of printing. © Copyright 2015 by Conrad Electronic SE.