KELLER Logger DCX 4.0 © KELLER AG – August 2004 St. Gallerstrasse 119 - CH-8404 Winterthur Tel.
Dear Customer, Congratulations on your purchase of KELLER Data Loggers DCX, the next generation Data Logger! Before installation and use of your new device as per your requirements, it is recommended that you read these instructions carefully. They contain important information for successful operation of the KELLER Logger DCX 4.0 software.
Table of Contents Installation of Data Logger DCX .......................................................................................................... 5 Dip pipe installation (DCX-22 AA, DCX-22 SG and DCX-22 VG) ....................................................... 5 Additional recommendations: .............................................................................................................. 6 Installation of the KELLER Logger DCX 4.0 software ............................................
Setting a mark ................................................................................................................................. 20 Description of individual modules ................................................................................................. 21 Airpressure-compensation (Airpressure-Comp.) ............................................................................ 21 Conversion to Waterlevel values (WL-Converter) .........................................................
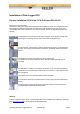
Installation of Data Logger DCX Dip pipe installation (DCX-22 AA, DCX-22 SG and DCX-22 VG) Revolution in level metrology: Gone are the days of the costly measuring stations at the lakes and rivers. The new generation of level measuring stations presents itself inconspicuously and vandal-proof and can be set up at considerably lower costs compared to conventional systems. Here is an application example at a barrage: The dip pipe is firmly mounted at the measuring place.
Additional recommendations: - - The battery capacity is not measured but calculated from the average current used. If the battery is replaced, as also upon Power-On-Reset, the display will be reset to 100%. A battery replacement is recommended if the battery capacity indicator displays a status of less than 30%. Continued read-out of large volumes of data is thereby guaranteed.
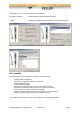
Under Install Type, you may choose the type of installation: Typical and Compact: Default installation without additional modules Custom: Installation of additional modules WISKI-Conversion and Overstort Finally, you can specify the Program Folder to be created under Programs in the Start menu. Files installed KELLER Logger DCX 4.
The KELLER Logger DCX 4.0 software package The software consists of three main programs and additional modules. Both the configuration programs Writer and WriterWL are used to read and update the settings of the connected device, as also to start and end recording. WriterWL configures devices for water level applications, while the Writer is used for making general recordings. The Reader gives an overview of all records present in the connected device, and reads in the records selected.
Initialization The Data Logger DCX needs to be initialized before communication can be established with it. This can be done by clicking Read Configuration. If a device is present, its settings are read in and displayed in WriterWL. The device type, serial number, device time and PC time as well as the (total) memory available in the device are listed in the status window. The status bar shows the current recording status as well as the current time.
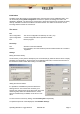
Options Configuration General: Setting the program language, activation/deactivation of auto detection of existing serial ports (changes will take place only upon program restart), and showing/hiding the picture. Units: The number of decimal places for the predefined units of pressure, temperature and length is specified here. In addition one user-defined pressure and length unit each can be specified, with details about conversion factors and decimal places.
Configuration functions Channels to record Here, the channels to record are selected by checking off the corresponding boxes: P1-P2 P1 P2 T TOB1 TOB2 Pressure Sensor 1 – Pressure Sensor 2 Pressure Sensor 1 Pressure Sensor 2 Optional temperature sensor Temperature Sensor 1 (Top of bridge) Temperature Sensor 2 (Top of bridge) Start time Specifies the time at which the device goes into recording mode at the earliest.
Building Mean value after X measurements at 1 second intervals This function enables the averaging over "X" measurements at intervals of one second each. Recording is initiated only after the average has been determined, even if the recording interval chosen is smaller. For example, "Recording interval after event” = 1 second, X = 5: A measured value is recorded once every 5 seconds.
Save if delta Channel > Val1 Recording only takes place if the measured value of the channel where event-driven recording is scheduled is greater by Val1 than the last recorded value. After Write Configuration a reference value will be recorded.
Endless (circular memory) This function is enabled by the user for continuous recording by the device. That is to say, earlier values get overwritten when the memory is full. Without this setting, the device stops recording when the memory is full.
Device type The type of connected Data Logger is indicated under Device type: - sealed gauge, air pressure compensated in each case (DCX-22 VG and DCX-22 AA) - absolute (DCX-22 SG), air pressure must be compensated separately (see AirpressureCompensation-module) Conversion to Recorded hydrostatic pressures can be converted into length values as per the water level configuration settings. This conversion is carried out by means of the module Waterlevel-Converter.
Water density / Calculate water density Entering the water density (for example. fresh water (20 °C) = 998.2 kg/m3) If the user does not know the water density, the software supports its calculation: By clicking Calculate water density the following screen appears. For the calculation we need the installation depth (B), the depth to water (C) as well as the current pressure value (D). The air pressure must also be entered if the device does not compensate for it.
Operation of Writer / WriterWL Units Pressure Temperature Length/height Bar °C m mBar °K inch mWs °F foot Fixed units PSI Pa kPa MPa mmHg ATM yard Sample specification of user-defined units on the configuration screen The units set in the main window are used in all further dialog boxes. Read Configuration Initialization of the connected data logger is commenced by clicking this button. Stop Record Clicking this stops any recording already started.
The Reader program (Reader) All recordings available in the device are listed by means of this program. Each recording selected is read out of the device and stored in a separate file. Depending on the selection of executing modules, these files are either further processed or only displayed. The files can also be processed later with the help of the individual modules. Initialization Before communications with the Data Logger DCX can be established, the latter needs to be initialized.
The menus File Exit: Exit the program Port-Setup Port: Modem: Selection of the serial interface Upon activation, the communication protocol for data transfer via a modem is negotiated. Options Configuration General: Setting the program language, activation/deactivation of auto detection of existing serial ports (changes will take place only upon program restart). Another option is to delete all the "*.idc"-files created when the program is exited.
Read-out of stored data After initialization, a list of all available recordings is displayed. Every recording is shown with a selection check box, a sequence number, start date and time, as well as memory used as a percent of total memory. The recordings to be read can be selected by checking off the box next to the recording number. Various modules can be selected for the display or further processing of the data.
Description of individual modules Each module can be directly invoked from the reader (data is transferred automatically). If the module is invoked directly, the file to be processed can be read by clicking "File – Open...”. Airpressure-compensation (Airpressure-Comp.) In this module one or more (if invoked from the Reader) files are compensated for air pressure. The air pressure is taken either from a previously created "*.idc” File, or a fixed air pressure (constant) is used for compensation.
Conversion to Waterlevel values (WL-Converter) Since the data logger pressure values are always measured and recorded in bar, this module is necessary for conversion to water level values. The configuration settings specified in WriterWL are re-displayed for verification. Clicking Convert leads to all measured values being converted into water levels. The unit for converted values is always meter (m). Warning! No new files are created, instead values in the current files are overwritten.
Creation of text data (Text-Converter) For display and/or further processing of measured values if required, conversion into a text file is necessary. This module creates such a file in tab-delimited format with the suffix ".txt". The file can be opened with any desired editor. It is however recommended that the file be imported into a commonly used spreadsheet program such as Microsoft Excel for a better overview.
Write User-Values into File: - Specify whether user-defined values created with the Writer are written into the file. Each value can also be given its own description. This description can in turn be used by a user macro or program to read in the required values. Write specified separators into File: - Since number, date and time formats are country-specific, they have to be localized, which can be done using this option.
Display module (Viewer) This module is used for displaying the measured values read out. The user can select the following options to customize the view: - Channels to be displayed Pressure and temperature units Zoom in and zoom out of the graph Display of cross-hair, grid and legend For better viewability, the pressure values can be inverted and displayed. This is especially recommended for files with water level values (virtual representation of the water height). Under "File – Save as Bitmap...
Files with water level values: If a file with converted water level readings is displayed, in older versions of the viewer, the pressure unit cannot be changed thereafter. This is indicated by the display of unit details [m] alongside the pressure channel. Example of a file converted into water level readings Hint: In Windows Explorer under "Extras – Folder options" specify Viewer as the program for opening files with the suffix "*.idc". Thereafter each .
WISKI-Converter The design of this module is very similar to that of the Text-Converter. It is also used for creation of a text-file which can be used for further processing or for display. Under "Options – Configuration - General" there are two selectable formats. ZRXP-Format: If the data is converted into this format, it can be displayed and processed with the WISKI - TimeSeriesViewer from the firm Kisters (30-day demo version available here).
Overstort-calculation (Overstort) In some countries (e.g. Holland, Belgium) water consumption is measured with the help of an overstort wall. The volume of water consumed is calculated from the measured water level minus the Trigger-invalue (Val1) configured with the WriterWL. This Trigger-in-value corresponds to the distance of the sensor from the overstort wall. Trigger-out (Val2) should be set to the value Trigger-in – 3cm, in order to attain a turn-off hysteresis.
APPENDIX Sample application Recording configuration: Fixed Save-Interval = 1 hour Event = Save if delta Channel > Val1, Val1 = 0.5 bar Event-Detect Interval = 1 second Save-Interval during the Event: = deactivated, correspondingly also 1 second = Start Recording (1. measure for compare) p[bar] = Recording with fixed Save interval (1 h.) = Event-Recording (delta > 0.5 bar) at 1 sec. int. 4.0 3.5 3.0 2.5 2.0 1.5 1.0 0.5 16.08.02 12.30 12.00 13.00 13.30 14.00 14.30 15.00 15.30 16.00 16.30 16.08.
Pressure Conversion Table bar kPa mWs/mH2O inchH2O mmHg(Torr) inchHg psi bar 1 100 10,1972 401,463 750,062 29,530 14,5038 kPa 0.01 1 0,101972 4,01463 7,50062 0,29530 0,145038 9,8067 1 39,3701 73,5559 2,8959 mWs/mH2O inchH2O -2 9,8067*10 -3 psi 3,613*10-2 0,535240 1 3,9370*10-2 1,9337*10-2 0,345316 13,5951 25.40 1 0,491154 0,70307 27.