Cisco SCA BB SNMP Real Time Monitoring User Guide Release 3.0.5 OL-12491-01 Corporate Headquarters C isco Sys te ms , Inc . 1 70 W es t Tas ma n D r i ve Sa n Jose , C A 9 513 4-1 706 USA h t t p : / /w w w .c i s c o .
THE SPECIFICATIONS AND INFORMATION REGARDING THE PRODUCTS IN THIS MANUAL ARE SUBJECT TO CHANGE WITHOUT NOTICE. ALL STATEMENTS, INFORMATION, AND RECOMMENDATIONS IN THIS MANUAL ARE BELIEVED TO BE ACCURATE BUT ARE PRESENTED WITHOUT WARRANTY OF ANY KIND, EXPRESS OR IMPLIED. USERS MUST TAKE FULL RESPONSIBILITY FOR THEIR APPLICATION OF ANY PRODUCTS.
CONTENTS Preface iii Document Revision History iii Audience iii Organization iii Related Documentation iv Conventions iv Obtaining Documentation v World Wide Web v Documentation CD-ROM v Ordering Documentation v Documentation Feedback vi Obtaining Technical Assistance vi Cisco.
Contents Using the SCA BB Real-Time Monitoring Configuration Utility 2-3 Installing the RTMCMD Utility and the RTM Report Templates 2-4 Installing the Java Runtime Environment 2-4 The Real-Time Monitoring Configuration Utility 3-1 The rtmcmd Utility 3-2 rtmcmd Utility Examples 3-3 The User Configuration File 3-3 rtmcmd User Configuration File Example 3-4 User Configuration File Format 3-4 Files and Directories 3-4 Installing the CFG and CGI Files for Use by MRTG and RRDTool 3-5 First Installation 3-5 Files
Preface This preface describes who should read the Cisco SCA BB SNMP Real-Time Monitoring User Guide, how it is organized, and its document conventions. Document Revision History Cisco Service Center Release Part Number Publication Date Release 3.0.5 OL-12491-01 November, 2006 DESCRIPTION OF CHANGES Created the Cisco SCA BB SNMP Real-Time Monitoring User Guide.
Preface Related Documentation Chapter 4 Troubleshooting (on page 4-1) Presents error messages and possible causes of the error.
Preface Obtaining Documentation Obtaining Documentation The following sections provide sources for obtaining documentation from Cisco Systems. World Wide Web You can access the most current Cisco documentation on the World Wide Web at the following sites: • http://www.cisco.com • http://www-china.cisco.com • http://www-europe.cisco.com Documentation CD-ROM Cisco documentation and additional literature are available in a CD-ROM package that ships with your product.
Preface Obtaining Technical Assistance Documentation Feedback If you are reading Cisco product documentation on the World Wide Web, you can submit technical comments electronically. Click Feedback in the toolbar and select Documentation. After you complete the form, click Submit to send it to Cisco. You can e-mail your comments to bug-doc@cisco.com.
Preface Obtaining Technical Assistance Contacting TAC by Using the Cisco TAC Website If you have a priority level 3 (P3) or priority level 4 (P4) problem, contact TAC by going to the TAC website http://www.cisco.com/tac. P3 and P4 level problems are defined as follows: • P3—Your network is degraded. Network functionality is noticeably impaired, but most business operations continue.
CHAPTER 1 Overview SNMP-based monitoring tools, such as MRTG, allow network administrators to monitor the activity and health of network devices in real time. Cisco SCA BB includes an SNMP-based realtime monitoring solution, which is implemented using MRTG and a Round Robin Database (RRDTool). The SCA BB Real-Time Monitoring Configuration Utility (rtmcmd) is a command-line utility (CLU) for automating the production of the files required by the MRTG tool.
Chapter 1 Overview Components of SNMP RTM with MRTG and RRDTool Components of SNMP RTM with MRTG and RRDTool Following are the components of an MRTG / RRDTool monitoring system: • MRTG is a script that collects SNMP data from monitored devices. It monitors SNMP network devices and stores the retrieved data in a database. It is written in Perl and works on Unix/Linux and Windows. MRTG is free software licensed under the Gnu GPL.
Chapter 1 Overview Pre-defined SCA BB Real-Time Monitoring Reports References Refer to the following links for RTM software components documentation and download: • PyCron (for windows setups): http://www.kalab.com/freeware/pycron/pycron.htm • ActivePerl (for running MRTG): http://www.activestate.com/Products/ActivePerl/ • Apache Web-Server: http://httpd.apache.org/download.
Chapter 1 Overview Pre-defined SCA BB Real-Time Monitoring Reports 15 Subscriber Counters 16 RDR Counters 17 Downstream Bandwidth per TX Queue 18 Upstream Bandwidth per TX Queue Reports Note the following general information regarding charts: • • Each report is actually made of the following four charts, representing different time scales. These charts are based on the round robin archives for each SNMP counter (the archives are created by MRTG).
Chapter 1 Overview SCA BB Real-Time Monitoring Setup The following diagram shows a report example. Figure 1-2: Sample Graph SCA BB Real-Time Monitoring Setup An RTM setup requires the installation of the components described in Components of SNMP RTM with MRTG and RRDTool (on page 1-2) and can be set up on either Windows or Unix/Linux servers. The Getting Started (on page 2-1) section provides a step by step description how to set up a SCA BB RTM system. SCA BB RTM system requires MRTG version 2.
Chapter 1 Overview SCA BB Real-Time Monitoring Setup The RTM Directory To view a report, RTM users browse to a URL mapped to a designated directory on their web server. This designated directory is referred to as the RTM directory. Users are required to create the RTM directory under the web server web documents directory tree; for example, when using an Apache web server on a Windows system, the RTM directory might be located at C:/PROGRA~1/APACHE~1/Apache2.2/htdocs/rtm.
CHAPTER 2 Getting Started This chapter contains the following sections: • Using MRTG and RRDTool for Real-Time SNMP Monitoring 2-1 • Web Server Configuration 2-2 • Using the SCA BB Real-Time Monitoring Configuration Utility 2-3 • Installing the RTMCMD Utility and the RTM Report Templates 2-4 Using MRTG and RRDTool for Real-Time SNMP Monitoring To produce graphics to monitor your network in real time using MRTG and RRDTool, follow these general steps: Step 1 Install MRTG (requires Perl installation) and
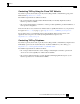
Chapter 2 Getting Started Web Server Configuration b) Select a report from the available reports listed on the left. The following figure is a screenshot taken after selecting an SCE device. This guide focuses on Step 5, creating the CFG and CGI files for MRTG and RRDTool. The SCA BB Real-Time Monitoring Configuration utility creates the necessary files from the specified PQB file or Service Configuration.
Chapter 2 Getting Started Using the SCA BB Real-Time Monitoring Configuration Utility /htdocs/"> Options Indexes FollowSymLinks ExecCGI AllowOverride Indexes Order allow,deny Allow from all • Restart the Apache Web Server Using the SCA BB Real-Time Monitoring Configuration Utility To use rtmcmd to produce the files for MRTG and RRDTood, follow this procedure: Step 1 If using rtmcmd for the first time, do the following: a) Install i
Chapter 2 Getting Started Installing the RTMCMD Utility and the RTM Report Templates Step 5 Install these CFG and CGI files into your RTM setup (see Installing the CFG and CGI Files for Use by MRTG and RRD (on page 3-5)). Installing the RTMCMD Utility and the RTM Report Templates To install the SCA BB rtmcmd utility and RTM report templates, complete the following steps: Step 1 Locate the file scas_bb_util.
CHAPTER 3 The Real-Time Monitoring Configuration Utility This chapter contains the following sections: • The rtmcmd Utility 3-2 • The User Configuration File 3-3 • User Configuration File Format 3-4 • Files and Directories 3-4 • Installing the CFG and CGI Files for Use by MRTG and RRDTool The Real-Time Monitoring Configuration Utility (rtmcmd) is a Cisco Service Control software tool for processing the SCA BB report templates into the appropriate CFG and CGI files.
Chapter 3 The Real-Time Monitoring Configuration Utility The rtmcmd Utility The utility compiles the templates and the PQB file into the actual CFG and CGI files required by MRTG and RRDTool, and stores the results in the specified target directory.
Chapter 3 The Real-Time Monitoring Configuration Utility The User Configuration File The following table lists these additional rtmcmd operations. Table 3-2 rtmcmd Operations Operation Description --version Display RTMCMD version --help Display RTMCMD help rtmcmd Utility Examples Create report and configuration files for the specified SCE platforms. Load the Service Configuration file from a local file: rtmcmd --sce="63.111.106.7;63.111.106.12" --file=servicecfg.
Chapter 3 The Real-Time Monitoring Configuration Utility User Configuration File Format rtmcmd User Configuration File Example The following is an example rtmcmd user configuration file: #The absolute path to the RRD tool's execution files folder #Use '\\' or '/' as path separator rrdtool_bin_dir=C:/rrdtool-1.2.15/rrdtool/Release #The absolute path where RTM files will be placed.
Chapter 3 The Real-Time Monitoring Configuration Utility Installing the CFG and CGI Files for Use by MRTG and RRDTool • • rtm_dir—The RTM directory is where MRTG will create and update the RRDTool archive files. It is recommended that the target directory provided to the rtmcmd will be different to the RTM directory.
Chapter 3 The Real-Time Monitoring Configuration Utility Installing the CFG and CGI Files for Use by MRTG and RRDTool */5 * * * * \wperl.exe \mrtg \mrtg-cfg\_scabb_mrtg.cfg (The exact details of working with Cron are outside the scope of this document.) rtmcmd creates two crontab.txt sample files for Windows and for Linux/Unix setups in the destination directory. Use these files to configure Cron.
Chapter 3 The Real-Time Monitoring Configuration Utility Installing the CFG and CGI Files for Use by MRTG and RRDTool Step 3 Update the report CGI files—Copy the updated CGI files from the SCE folder created in the rtmcmd target directory to the appropriate directory in the RTM directory. You can copy the entire SCE folder if this SCE device has not been monitored before.
CHAPTER 4 Troubleshooting This chapter contains the following sections: • Error Message when Viewing a Report • Reports Missing Data 4-1 4-3 Error Message when Viewing a Report Problem Apparent Error Message: viewing a report returns with an error message Error opening .rrd: No such file or directory. Cause and Solution MRTG did not create RRD DB files. Verify that your /sce_ does not contain *.rrd files.
Chapter 4 Troubleshooting Error Message when Viewing a Report 2. Cron did not invoke MRTG a) Verify Cron is configured correctly—Check the MRTG invocation command for the specific SCE platform is correct. b) If using PyCron, try running MRTG from PyCron GUI and verify it completes with return code 0 Problem Apparent Error Message: viewing a report returns with an error message The server encountered an internal error or misconfiguration and was unable to complete your request.
Chapter 4 Troubleshooting Reports Missing Data Reports Missing Data Problem Reports missing data. There is a sheer drop in reported traffic. Cause and Solution Cron has stopped invoking MRTG 1. Verify the *.rrd files in the folder sce_ haven’t been modified during the past 5 minutes. 2. Verify Cron is configured as a service and that the service active. 3. Run MRTG from a command line and verify that it completes with no errors.