
Specifications

21
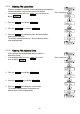
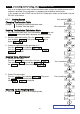
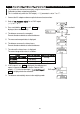
1 Press the RE-ZERO key to set the display to zero.
2 Place the sample on the weighing pan and wait for the stabilization
indicator to turn on.
3 Press the PRINT key to add the data displayed to statistical
calculation. The number of data on the upper left of the display
increases by 1.
4 Repeat steps 1 to 3 for each weighing.
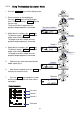
Outputting The Statistical Results
5 Each time the MODE key is pressed, the display
changes: the results as selected in "Statistical function
mode output items (5taf)", and .
6 While the results are displayed, press the PRINT key to
output the results.
Notes
When the number of data is 1, the coefficient of
variation is displayed as - - - - - - - .
When the average is 0, the coefficient of variation
is displayed as - - - - - - - .
Statistical items are indicated on the upper left of
the display using the following symbols.
Symbol Statistical item
5um Sum
1max Maximum
1min Minimum
1r Range (Maximum – minimum)
1ave Average
15d Standard deviation
1Cv Coefficient of variation
Mmax% Relative error of maximum value
Mmin% Relative error of minimum value
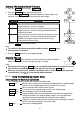
Weighing pan
Sampl
e
Displays the
statistical
results
selected in the
Output the results
6.5.4. Clearing The
Statistical Data
6.5.3. Deleting The
Latest Data
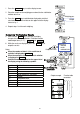
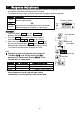
Output example Function table
parameter
0
1
2
3