
User manual

Running the Demonstration
XAPP794 (v1.3) December 20, 2013 www.xilinx.com 28
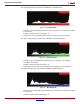
Understanding the Image Statistics
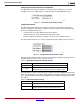
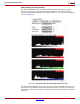
The Xilinx Image Statistics IP core provides hardware-based image analysis to support
auto-focus, auto-exposure, and auto-white balance applications. The third column in the
web-based GUI provides feedback from the image statistics IP core in the form of histograms,
as shown in Figure 26.
Four histograms are displayed. The content of each histogram is described by the color bar at
the bottom of each histogram. The intensity histogram has a gray color bar, the red channel
histogram has a red color bar, the green histogram has a green bar, and the blue histogram has
a blue bar.
X-Ref Target - Figure 26
Figure 26: Histograms from the Xilinx Image Statistics IP Core
X794_26_110513