
User manual

Running the Demonstration
XAPP794 (v1.3) December 20, 2013 www.xilinx.com 29
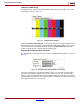
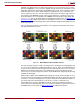
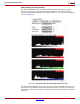
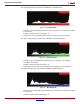
The intensity histogram (Figure 27) provides information about the overall image exposure.
In addition to the histogram distribution of the data, the bar at the top of the histogram provides
visual feedback on the exposure:
• A red bar on the top left indicates that the image is under-exposed according to the
formula:
(number of pixels in the 0–64 range) * (under-exposure threshold) > (number of pixels in
the 64–192 range)
• A red bar on the top right indicates that the image is over-exposed according to the this
formula:
(number of pixels in the 192–255 range) * (over-exposure threshold) > (number of pixels in
the 64–192 range)
• A green bar on the top indicates that the image has good exposure (neither
under-exposed or over-exposed)
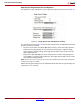
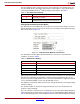
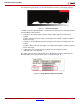
The under- and over-exposure thresholds can be adjusted by moving the Under-Exp and
Over-Exp sliders at the top of the third column, as shown in Figure 28.
X-Ref Target - Figure 27
Figure 27: Intensity Histogram
X-Ref Target - Figure 28
Figure 28: Image Statistics Exposure Controls
X794_27_110513
X794_28_110513