
User Guide

ACDSee Pro 2.5 - User Guide
138
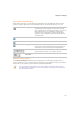
When you click on one of the pickers in the Exposure tab, and then hover over an
image, the cursor changes to an eye dropper. If you look in the status bar, you will
see two R G B numbers changing as you move around the image. The two numbers
indicate the R G B values of the pixel under the cursor. The R G B values represent
the source pixel (unprocessed) and the current pixel as it appears on the screen.
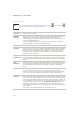
Light EQ options
Brighten
sliders (top)
Drag the sliders up to increase the brightening in each tonal band. The
sliders on the left affect dark tones. The sliders on the right, bright tones.
Moving a slider changes the amount of brightening only in that particular
tonal band in the image.
You can also type a number into the number boxes and increment them
slowly to make precise adjustments.
Darken
sliders
(bottom)
Drag the sliders down to increase the darkening in each tonal band. The
sliders on the left affect dark tones. The sliders on the right, affect bright
tones. Moving a slider changes the amount of darkening only in that
particular tonal band in the image.
You can also type a number into the number boxes and increment them
slowly to make precise adjustments.
Orange
Graph
The orange graph indicates the amount of brightening and darkening
applied throughout the tone range of the image. The portion of the graph
above the horizontal axis corresponds to brightening, while the portion of
the graph below the horizontal axis corresponds to darkening. When both
brightening and darkening are applied within the same tonal band, contrast
is increased. The area between the top of the brightening graph and the
bottom of the darkening graph indicates the relative increase of contrast
throughout the tone range of the image.
Number of
tone bands
Click the drop-down list to increase or decrease the number of tonal bands
that you can adjust.