
Specifications


33
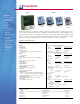
This powerful and easy-to-use power quality analysis software program is
developed exclusively for ACR’s voltage disturbance recorder, the PowerWatch.
With no programming hassles or complex menus, setup and downloading
occurs in seconds. Connection is simple: plug the optical interface cable (LIC-
101 cable) into the serial port of your computer and point the other end to the
optical port on the PowerWatch. Communication begins immediately.
Detailed site reports are displayed for every voltage disturbance event record-
ed including:
• Hot-to-Neutral and/or Neutral-to-Ground Surges
• Hot-to-Neutral and/or Neutral-to-Ground Sags
• Hot-to-Neutral and/or Neutral-to-Ground Impulses
• Outages
• Frequency Variations
Order Information
MODEL DESCRIPTION CATALOG #
PWV-100 PowerWatch Interface Package* 01-0060
PW PowerWatch Software - Full Install 34-0004
*
Includes software on CD, interface cable, and manual
PowerWatch Software
FEATURES
• Simple and easy
to use
• User-selectable
threshold limits
• Detailed site
reports
• Hot-to-neutral and
neutral-to-ground
readings
• Quick summary
option
• Determine event
importance
For PowerWatch Voltage Disturbance Recorder
Compatible with Windows® 3.1,
,
95,
,
98, 2000, Me, NT and XP
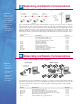
With the Quick Summary option, all events are summarized and displayed individually in a bar graph format.
This helps determine power quality trends quickly and effectively. The Event Distribution Graph plots the
magnitude of events against duration on a logarithmic scale, allowing you to determine the importance of
the data (a single random event may not be as important as a cluster of events). The Event Distribution
Graph also helps determine what kind of power quality problems you have as all 4000 events can be plot-
ted on this graph. You have the choice of analyzing hot-to-neutral or neutral-to-ground events or showing
both in different colors. The CBEMA Curve can be used to determine the importance of each event.
Easy setup and downloading
Detailed Site Reports Quick Summary
Event Distribution Graph