
Specifications


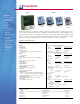


TrendReader® Standard 2 Software
34
FEATURES
• Serial & USB port
interface
• Fast and easy log-
ger setup
• One-touch table
views
• Presentation-quality
graphs
• Multi-graph display
• Zooming capabilities
• Export capabilities
(TXT, BMP, PDF, JPG or
CSV formats)
• Real-time readings
For SmartReader Plus, SmartReader, IAQ and OWL Data
Loggers
-
Compatible with Windows® 2000 and XP
TrendReader® Standard 2 is a powerful, versatile, and easy-to-use software package designed exclusively for
ACR’s SmartReader Plus, SmartReader, IAQ and OWL data loggers. Powerful features and easy setup
enables logged data to be collected and thoroughly analyzed in seconds.
Order Information
MODEL DESCRIPTION CATALOG #
TRS2-w/IC-101 TrendReader Std/IC-101 Package 01-0225
TRS2-w/IC-102 TrendReader Std/IC-102 Package 01-0226
TRS2-w/LIC-101 TrendReader Std/OWL Interface Package 01-0227
TRS2-Full Install TrendReader Std - Full Install 01-0228
TRS2-Upgrade TrendReader Std - Upgrade 01-0229
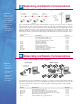
DOWNLOADING AND COMMUNICATING WITH DATA LOGGER
Set up, download and view information from a single data logger with ACR’s IC-102 interface cable
(included in software interface package). Connection is simple: plug the interface cable into the USB port
of your computer and connect the other end to the logger. No tools, cards or docking stations are
required. To communicate from a modem or a network of data loggers, see Networking and Remote
Communications sheet.
Export Data
Use the export function in TrendReader® Standard 2 to export your data to other programs for further analy-
sis. Data can be exported in TXT, BMP, PDF, JPG or CSV formats.
SETTING UP DATA LOGGER
With built-in menus for sample rate and mode, start delay, equations and more,
logger setup is fast and easy. In addition, equations are already included for all
ACR sensors so you need only select the appropriate equation from the menu or
customize your own equation. Real-time readings are displayed in the Setup win-
dow, allowing you to verify that your logger is working correctly before placing
it in the field.
VIEWING DATA
With TrendReader® Standard 2, data can be viewed in table
or graphical format. For presentation purposes, view data in
graphical format or for a more detailed analysis, view data in
table format. Either way, multiple channels of data can be dis-
played at once. Multiple graphs can be displayed at once and
compounded to create new graphs. For added presentation
power, add comments, change graph colours, zoom in on spe-
cific portions of data, and display your data using custom
engineering units. Print or copy and paste graphs into your
reports and presentations. Select all or portions of the table
and copy and paste into your favorite Windows® program.
Logger Setup