Additel/LogII Wireless Data Logging Software User Manual Additel Corporation 2013-8
Contents Chapter One: Overview......................................................................................................................... 3 1. Introduction ..............................................................................................................................3 2. System Requirements...............................................................................................................3 3. Software Installation .....................................................
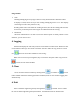
Chapter One: Overview 1. Introduction Additel/LogII Wireless is specially designed to collect real-time data of pressure units under test (UUT). It is a necessary software in pressure data logging. The features of Additel/LogII Wireless: It can automatically scan pressure gauges connected to the computer. Graphical interface can display the real-time pressure value and draw the curve for UUTS. Supports multiple instruments under test at the same time.
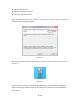
Windows Installer 3.1 Windows Imaging Component Microsoft .NET Framework 4 Third, The Wizard interface will appear as shown in below picture. Users can finish the installation by following this Wizard. Figure 1-1 When the installation is finished, the following icon will be shown on the desktop. As below picture 1-2.
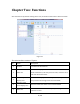
Chapter Two: Functions Start the software by double-clicking above icon, the main interface will be shown as below. Figure 2-1 The main interface consists of 5 parts: No. 1 Name Description Toolbar It includes all the functions. The list will display all the connected UUTs. It shows the 2 UUTs’ list UUTs’ information, real-time pressure value, real-time curve and main function buttons.
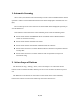
1. Automatic Scanning Once it starts, the software will automatically scan the connected UUTS without manual operation. And the relevant UUT information frame will be displayed in the UUTs’ list area (#2). The real-time pressure value and curve of selected UUT will be displayed separately in area #3 and #4 too. If the software cannot detect the connected UUT, please check the following items. Please check whether the WMD970 driver is installed and the Wireless Master station is connected correctly.
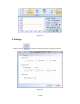
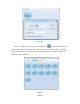
Figure 2-2 3. Settings Click the button on toolbar, the Settings interface appears as below.
General Logging Interval It means the interval time between 2 stored data. Logging Duration Means the total time of the whole logging process will last. The default value will never stop the logging process, users can decide when to stop it according to requirements. Please set time before logging. Communication The default value of channel of the Wireless Master station is 1. Please change it in your mind. Format Chart Style To set the display mode of the Chart.
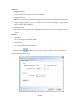
Figure 2-4 Gauge Profile Scale Reading multiplying factor (range: 0.900 to 1.100). Standard value should be 1.000. If display is 1.500, when we key-in the reading multiplying factor to 1.1. The display will change to read 1.650 (1.500 x 1.100) Reading offset value. If we offset the reading of 0.123, then all the reading will be minus 0.123 even you off the power and on again. It is different from the zeroing. Resolution Selection of Resolution.
Figure 2-5 Users can change the pressure unit by clicking button on each frame of UUTs. If you want to change the current pressure unit , please select the Custom Mode. And in the Custom Mode you can finde the pressure unit which is defined by yourself. The Automatic Mode is checked in system by default.
7. View There are 3 different kinds of view for the interface, Details, List and Classical. The default is Details, as shown in below picture 2-1. Users can switch among them as per requirements by clicking the buttons in the “view” menu. Figure 2-7 8. Data Manager Click button on the toolbar or buttons on each frame of UUTs to enter into the data managing window. This window includes the following functions. Search Users can search the stored data by setting time or inputting S/N of UUTs.
Figure 2-8 12 / 12