
User Guide


CHAPTER 8
184
Effects Menu – Edit View
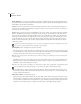
Pitch Bender dialog
Pitch Graph Use the graph to draw your tempo change over time. The x-axis (lower horizontal border) of the graph
represents the sound file or highlighted section’s time duration, while the y-axis (right vertical border) represents pitch,
measured in semitones or beats-per-minute, depending on the Range button pushed. Higher points on the curve speed
up the sound, while lower points slow it down.
Note: For more information about Adobe Audition’s graph controls (such as how to add and remove control points), see the
“Looking at the Work Area” chapter.
Spline Check the Spline box to generate a smoother, best fit curve instead of a straight line between control points on
the graph. When you use Spline Curves, the line will not ordinarily travel directly through the control points; rather, the
points control the shape of this curve. To get the curve closer to a control point, click to create more control points near
the point in question. The more control points there are clustered together, the closer the spline curve will be to those
points. Use Spline Curves when you want very smooth curves instead of straight lines (with their discontinuities at the
control points).
Flat Press this button to reset the graph, with all points being set to no pitch bending.
Zero Ends If you’re pitch bending the middle of a selection, it’s good to have the endpoints be at the same rate as the
surrounding audio. Pressing this button will set the endpoints to no pitch shift.