
User guide

Chapter 8: Generating Reports
56 Avaya Meeting Exchange Web Portal 5.1 User Guide November 2008
3. Select what type of report you want to generate.
For more information, see Web Portal Reports on page 55.
4. Select the date that you want the report generation to start from the Start Day drop down
list.
5. Select the date that you want the report generation to end from the End Day drop down
list.
6. Select, from the following options, the chart type. The report data is displayed in this
format:
● Vertical Bar Chart
● Line Chart
● Pie Chart
● Area Chart
● Stacked Area Chart
● Horizontal Bar Chart
● 3D Vertical Bar Chart
● 3D Horizontal Bar Chart
● 3D Stacked Vertical Chart.
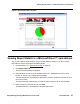
7. Click Generate Report.
The report is generated and the graphical representation of the data is displayed on
screen.