Measurement Guide and Programming Examples Agilent CSA Spectrum Analyzer This manual provides documentation for the following instruments: Agilent CSA N1996A-503 (100 kHz to 3 GHz) N1996A-506 (100 kHz to 6 GHz) For firmware revision A.01.
Notice The material contained in this document is provided “as is,” and is subject to being changed, without notice, in future editions. Further, to the maximum extent permitted by applicable law, Agilent disclaims all warranties, either express or implied with regard to this manual and any information contained herein, including but not limited to the implied warranties of merchantability and fitness for a particular purpose.
Where to Find the Latest Information Documentation is updated periodically. For the latest information about Agilent Technologies CSA spectrum analyzers, including firmware upgrades and application information, please visit the following URL: http://www.agilent.com/find/csa Microsoft® is a U.S. registered trademark of Microsoft Corporation.
Contents 2. Options and Accessories Ordering Options and Accessories . . . . . . . . . . . . . . . . . . . . . . . . . . . . . . . . . . . . . . . . . . . . 40 Options . . . . . . . . . . . . . . . . . . . . . . . . . . . . . . . . . . . . . . . . . . . . . . . . . . . . . . . . . . . . . . . . . 41 Option Descriptions . . . . . . . . . . . . . . . . . . . . . . . . . . . . . . . . . . . . . . . . . . . . . . . . . . . . . . . 44 Accessories . . . . . . . . . . . . . . . . . . . . . . . . . . . . . . . . .
Table of Contents Contents 8. Concepts Resolving Closely Spaced Signals . . . . . . . . . . . . . . . . . . . . . . . . . . . . . . . . . . . . . . . . . . . .130 Trigger Concepts . . . . . . . . . . . . . . . . . . . . . . . . . . . . . . . . . . . . . . . . . . . . . . . . . . . . . . . . .132 AM and FM Demodulation Concepts . . . . . . . . . . . . . . . . . . . . . . . . . . . . . . . . . . . . . . . . .133 Stimulus Response Measurement Concepts . . . . . . . . . . . . . . . . . . . . . . . . . . . . .
Installation and Setup 1 Installation and Setup 9
Installation and Setup This chapter provides the following information that you may need when you first receive your spectrum analyzer: • “Introduction” on page 11 • “Initial Inspection” on page 12 • “Power Requirements” on page 27 • “Physically Securing Your Analyzer” on page 31 • “Turning on the Analyzer for the First Time” on page 32 Installation and Setup • “Printer Setup and Operation” on page 35 • “Protecting Against Electrostatic Discharge” on page 36 • “Safety Information” on page 14 10 Chapter
Installation and Setup Introduction Introduction Basic test functionality includes: • Spectrum Analysis Mode • Channel Analyzer Mode including the following measurements: — Adjacent Channel Power Stimulus/Response Mode (requires N8995A and either option TG3 or TG6) includes the following measurements: • Two Port Insertion Loss • One Port Insertion Loss • Return Loss • Distance to Fault In this chapter, you will learn how to set up the N1996A, and you will learn to perform one basic measurement to start
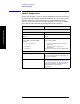
Installation and Setup Initial Inspection Initial Inspection Inspect the shipping container and the cushioning material for signs of stress. Retain the shipping materials for future use, as you may wish to ship the analyzer to another location or to Agilent Technologies for service. Verify that the contents of the shipping container are complete. The following table lists the items shipped with the analyzer.
Installation and Setup Initial Inspection If There Is a Problem If the shipping materials are damaged or the contents of the container are incomplete: • Contact the nearest Agilent Technologies office to arrange for repair or replacement (“Calling Agilent Technologies” on page 191). You will not need to wait for a claim settlement. • Keep the shipping materials for the carrier’s inspection.
Installation and Setup Safety Information Safety Information General This product and related documentation must be reviewed for familiarization with safety markings and instructions before operation. Installation and Setup This product has been designed and tested in accordance with IEC Publication 61010-1+A1+A2:1992 Safety Requirements for Electrical Equipment for Measurement, Control and Laboratory Use and has been supplied in a safe condition.
Installation and Setup Safety Information Safety Symbols and Product Markings The following safety symbols and product markings are located on the analyzer or the external power supply. Familiarize yourself with the symbols and their meaning before operating this analyzer. ! The instruction documentation symbol. The product is marked with this symbol when it is necessary for the user to refer to the instructions in the documentation. Indicates hazardous voltages.
Installation and Setup Safety Information Safety Considerations For This Analyzer This is a Safety Class 1 Product (provided with a protective earth ground incorporated in the power cord). The mains plug shall be inserted only in a socket outlet provided with a protected earth contact. Any interruption of the protective conductor inside or outside of the product is likely to make the product dangerous. Intentional interruption is prohibited.
Installation and Setup Safety Information The front panel switch is a standby switch only; it is not a LINE switch (power disconnecting device). WARNING Install the product so that the detachable power cord is readily identifiable and easily reached by the operator. The detachable power cord is the product disconnecting device. It disconnects the mains circuits from the mains supply before other parts of the product. The front panel switch is only a standby switch and is not a LINE switch.
Installation and Setup Installation and Setup Safety Information CAUTION The external power supply has autoranging line voltage input. Be sure the supply voltage is within the specified range. (Refer to the specifications guide for your analyzer.) CAUTION When operating this product with the external power supply, always use the three-prong power cord supplied with this product. Failure to ensure adequate earth grounding by not using this cord can cause product damage.
Installation and Setup Safety Information Battery Pack Product Safety Data Sheet Installation and Setup Product Safety Data Sheet PRODUCT NAME: Inspired Energy Rechargeable Battery Pack Model: NF2040A22 TRADE NAME: NF2040 Volts: 10.8 CHEMICAL SYSTEM: Lithium Ion Approximate Weight: 340 g SECTION I – MANUFACTURER INFORMATION Inspired Energy, Inc.
Installation and Setup Safety Information Battery Pack Declaration of Conformity Installation and Setup Declaration of Conformance PRODUCT: Standard Battery for Inspired Energy Inspired Energy Part Number: NF2040 SECTION I – MANUFACTURER INFORMATION Inspired Energy, Inc. 25440 NW 8th Place, Newberry FL 32669, USA Telephone: +1 386 462 3676 Date Prepared: December 21st 2004 SECTION II – CONFORMANCE INFORMATION The listed products have been tested in accordance with the UN document ST/SG/AC.10/11/Rev.
Installation and Setup Safety Information Batteries: Safe Handling and Disposal Installation and Setup Chapter 1 21
Installation and Setup Installation and Setup Safety Information 22 Chapter 1
Installation and Setup Safety Information Installation and Setup Chapter 1 23
Installation and Setup Installation and Setup Safety Information 24 Chapter 1
Installation and Setup Safety Information Installation and Setup Chapter 1 25
Installation and Setup Installation and Setup Safety Information 26 Chapter 1
Installation and Setup Power Requirements Power Requirements Typically, the only physical installation of your Agilent spectrum analyzer is a connection to a power source. WARNING Before operating or connecting this analyzer to an external power source, please read and understand safety information in “Safety Information” on page 14 and the safety considerations and all safety warnings in “Safety Considerations For This Analyzer” on page 16.
Installation and Setup Power Requirements Installation and Setup Various AC power cables are available that are unique to specific geographic areas. You can order additional AC power cables for use in different areas. AC Power Cords, on page 29 lists the available AC power cables, illustrates the plug configurations, and identifies the geographic area in which each cable is appropriate.
Installation and Setup Power Requirements Table 1-2 AC Power Cords Installation and Setup Chapter 1 29
Installation and Setup Power Requirements Clock Battery Information The analyzer uses a Poly-carbonmonofluoride Lithium Coin battery to power the analyzer clock. The battery is located on the CPU board. If the analyzer’s clock does not work, the problem is probably the battery. See “Returning an Analyzer for Service” on page 193. WARNING Danger of explosion if battery is incorrectly replaced. Replace only with the same or equivalent type recommended.
Installation and Setup Physically Securing Your Analyzer Physically Securing Your Analyzer To prevent unauthorized removal of your analyzer, you can use a Kensington Slim MicroSaver security cable to attach the analyzer to an immovable object. Your analyzer has a Kensington Security Slot located on the back of the analyzer. The Kensington Security Slot is identified on the analyzer with this logo: . For more information, visit http://www.microsaver.com.
Installation and Setup Turning on the Analyzer for the First Time Turning on the Analyzer for the First Time Installation and Setup WARNING Before operating or connecting this analyzer to an external power source, please read and understand safety information in “Safety Information” on page 14 and the safety considerations and all safety warnings in “Safety Considerations For This Analyzer” on page 16. ❏ Plug in the power cord.
Installation and Setup Turning on the Analyzer for the First Time — Press Save. — Connect the LAN cable to the LAN connector (not the Timing LAN connector) located on the rear panel of your analyzer (see “Rear-Panel Features” on page 61). — Cycle the analyzer power. Refer to “Configuring for Network Connectivity” on page 158 NOTE It is necessary to cycle the power to the analyzer after plugging in the LAN for the analyzer to recognize the network.
Installation and Setup Firmware Revision Firmware Revision To view the firmware revision of your analyzer, press Mode. If you call Agilent Technologies regarding your analyzer, it is helpful to have this revision and the analyzer serial number available.
Installation and Setup Printer Setup and Operation Printer Setup and Operation The Agilent CSA spectrum analyzer does not print directly to a printer. You can print a screen image or measurement data by first saving the information to a USB memory device and then use a PC with an attached printer to print the file. You can save a screen image by pressing (Print) (for detail instructions, refer to “Printing a Screen To a File” on page 153).
Installation and Setup Protecting Against Electrostatic Discharge Protecting Against Electrostatic Discharge Electrostatic discharge (ESD) can damage or destroy electronic components (the possibility of unseen damage caused by ESD is present whenever components are transported, stored, or used).
Installation and Setup Using the Soft Carrying Case Using the Soft Carrying Case The N1996A soft carrying case is designed to hold the analyzer as well as its cables and accessories. Installation and Setup WARNING Always disconnect the analyzer from the external power supply before storing the analyzer in the soft carrying case.
Installation and Setup Installation and Setup Using the Soft Carrying Case 38 Chapter 1
Options and Accessories 2 Options and Accessories This chapter lists options and accessories available for your analyzer.
Options and Accessories Ordering Options and Accessories Ordering Options and Accessories Options and accessories help you configure the analyzer for your specific applications. Options (see page 41) Unless specified otherwise, all options are available when you order a spectrum analyzer; some options are also available as kits that you can order and install after you receive the analyzer. Order kits through your local Agilent Sales and Service Office.
Options and Accessories Options Options Each option is described below in alpha/numeric order according to option number. Option Number 0950-4745 Name External AC/DC Power Supply Description External power supply 15 VDC 130 W 0BW Service Documentation The Service guide describes assembly-level troubleshooting procedures, provides a parts list, and documents post-repair procedures. 1CM Rack Mount Kit Includes rack mount flanges and hardware.
Options and Accessories Options Option Number Name BCG External Battery Charger Description External charger/DC adapter, includes: HTC Hard Transit Case External power supply AC/DC adapter Dual battery charger The hard transit case will survive commercial transportation. This rugged case has two wheels and an extendible handle for easy transport. The case can also accommodate two battery packs and ac adapters.
Options and Accessories Options Option Number TG6 Name Description 6 GHz Tracking Generator Provides a 100 kHz to 6 GHz built-in tracking generator. This source creates a source-receiver combination that allows insertion-loss, frequency response, and return-loss measurements. The source-receiver combination has a wide distortion-free dynamic range, plus good sensitivity and selectivity. (Must be installed for use with the N8995A Stimulus/Response Measurement Suite.) For use with Option 506 only. 1.
Options and Accessories Option Descriptions Option Descriptions Each option is described below in alphabetical order. Option Number Name 3 Year Inclusive Calibration Contract R-50C-011-3 3-Year Warranty Service Support 1 R-51B-001-3C 100 kHz to 3 GHz Specrtum Analyzer1 503 100 kHz to 6 GHz Specrtum Analyzer1 506 Battery Pack BAT External AC/DC Power Supply 0950-4745 Description Provides your analyzer with a 3 year analyzer calibration contract.
Options and Accessories Option Descriptions Option Number Name Description An internal preamplifier assembly. Preamplifier, 3 GHz P03 Frequency Range: 100 kHz to 3 GHz Preamplifier, 6 GHz P06 An internal preamplifier assembly. Frequency Range: 100 kHz to 6 GHz Rack Mount Kit 1CM Includes rack mount flanges and hardware. Used to rack mount analyzers without front handles (available as P/N 5063-9215 and N1996-60021).
Options and Accessories Option Descriptions Name Tracking Generator, 6 GHz Option Number Description TG6 Provides a 100 kHz to 6 GHz built-in tracking generator. This source creates a source-receiver combination that allows insertion-loss, frequency response, and return-loss measurements. The source-receiver combination has a wide distortion-free dynamic range, plus good sensitivity and selectivity. (Must be installed for use with the N8995A Stimulus/Response Measurement Suite.
Options and Accessories Accessories Accessories A number of accessories are available from Agilent Technologies to help you configure your analyzer for your specific applications. They can be ordered through your local Agilent Sales and Service Office and are listed below. Manual Set on CD-ROM The documentation CD-ROM contains the standard documentation set in electronic (PDF) format as well as Adobe Acrobat Reader with Search.
Options and Accessories Accessories 50 Ohm/75 Ohm Minimum Loss Pad The Agilent 11852B is a low VSWR minimum loss pad that allows you to make measurements on 75 Ohm devices using an analyzer with a 50 Ohm input. It is effective over a frequency range of dc to 2 GHz. 75 Ohm Matching Transformer The Agilent 11694A allows you to make measurements in 75 Ohm systems using an analyzer with a 50 Ohm input. It is effective over a frequency range of 3 to 500 MHz.
Options and Accessories Accessories RF and Transient Limiters The Agilent 11867A and 11693A RF Limiters protect the analyzer input circuits from damage due to high power levels. The 11867A operates over a frequency range of dc to 1800 MHz and begins reflecting signal levels over 1 mW up to 10 W average power and 100 watts peak power. The 11693A microwave limiter (0.1 to 12.4 GHz, usable to 18 GHz) guards against input signals over 1 milliwatt up to 1 watt average power and 10 watts peak power.
Options and Accessories Options and Accessories Accessories 50 Chapter 2
Front and Rear Panel Features This chapter gives you an overview of the front and rear panels of your analyzer. For details on analyzer keys and remote programming, refer to the User’s and Programmer’s Reference. For connector specifications (including input/output levels), see the Specifications guide.
Front and Rear Panel Features Front Panel Overview Front Panel Overview This section provides information on the analyzer’s front panel, including: • “Front-Panel Connectors and Keys”, see below. • “Display Annotations: Spectrum Display” on page 55. • “Display Annotations: Spectrogram (Option 271)” on page 58. Front-Panel Connectors and Keys Item Front and Rear Panel Features Description # Name 1 Menu Keys Menu labels identifying the current function of each menu key appear to the left of each key.
Front and Rear Panel Features Front Panel Overview Item Description # Name 4 Marker Keys Enable markers to obtain specific information about the displayed measurement. 5 Utility Keys Access features used with all analyzer modes and affects the state of the entire spectrum analyzer. See your User’s guide for more details. System functions affect the state of the entire analyzer. Various setup and adjustment routines are accessed with the System key.
Front and Rear Panel Features Front Panel Overview Item Description # 18 Turns the analyzer on. A green light indicates power on. A yellow light indicates standby mode. Power On/Standby NOTE The front-panel switch is a standby switch, not a LINE switch (disconnecting device); the analyzer continues to draw power even when the line switch is in standby. Use the detachable power cord to disconnect the analyzer from the mains supply.
Front and Rear Panel Features Front Panel Overview Display Annotations: Spectrum Display Item Description Associated Function Keys Amplitude scale AMPTD Y Scale, Scale Type or AMPTD Y Scale, Scale/Div 2 Reference level AMPTD Y Scale, Ref Level 3 Auto Range On indicator AMPTD Y Scale, Auto Range 4 Active function block Refer to the description of the activated function.
Front and Rear Panel Features Front Panel Overview Item Description 8 Over Range: Indicates that the attenuation and preamp (if installed) settings are supplying too much power to the detector. Distortion may result. Set Auto Range (On) to clear. Associated Function Keys AMPTD Y Scale, Elec Atten AMPTD Y Scale, Internal Preamp AMPTD Y Scale, Auto Range or <8 Smpl/Pt: Indicates that the current instrument settings have reduced the number of samples/display point to less than 8.
Front and Rear Panel Features Front Panel Overview Item Description Associated Function Keys 25 Resolution Bandwidth BW, Res BW 26 Start frequency or if in zero span, 0 sec FREQ Channel, Start Freq Front and Rear Panel Features Chapter 3 57
Front and Rear Panel Features Front Panel Overview Display Annotations: Spectrogram (Option 271) Front and Rear Panel Features Item Description Associated Function Keys 1 Amplitude scale AMPTD Y Scale, Scale Type or AMPTD Y Scale, Scale/Div 2 Reference level AMPTD Y Scale, Ref Level 3 Auto Range On indicator AMPTD Y Scale, Auto Range 4 Active function block Data entry field for the active function.
Front and Rear Panel Features Front Panel Overview Item Description 7 Over Range: Indicates that the attenuation and preamp (if installed) settings are supplying too much power to the detector. Distortion may result. Set Auto Range (On) to clear.
Front and Rear Panel Features Front Panel Overview Item Metrics Panel Associated Function Keys Displays measurement results data metrics.
Front and Rear Panel Features Rear-Panel Features Rear-Panel Features Item # Description Name 1 Battery Compartment Location of the two batteries that provide DC power to the analyzer. 2 DC Power The input for the dc power source. Refer to “Power Requirements” on page 27. 3 USB, Type A Allows connections of external devices such as an external memory device. 4 USB, Type B Allows connections of external devices such as a PC controller.
Front and Rear Panel Features Rear-Panel Features Item # Description Name Reserved for future use. 11 Kensington lock Slot Used in conjunction with Kensington Lock to secures analyzer to work space. 12 Mounting tabs Mounting tabs for mounting the external power supply when analyzer is rack mounted. 13 Grounding lug Ground connector.
Front and Rear Panel Features Key Overview Key Overview The keys labeled FREQ Channel, System, and Marker are all examples of front-panel keys. The front-panel keys are dark gray, light gray, green, beige, or white in color. Front-panel keys that are white perform an immediate action rather than bringing up a menu. The only green keys are the Mode Preset, User Preset, and Help keys. The Mode Preset and User Preset keys perform an analyzer reset and the Help key accesses the embedded help system.
Front and Rear Panel Features Key Overview In other key menus, one key label will always be highlighted to show which key has been selected but the menu is immediately exited when a selection is made. For example, when you press the Avg Type key (on the Meas Setup menu), it will bring up its own menu of keys. The Log-Pwr Avg key, which is the Avg Type menu default key, will be highlighted.
Recommended Test Equipment 4 Recommended Test Equipment 65
Recommended Test Equipment Recommended Test Equipment Test Equipment for Making Measurements Test Equipment for Making Measurements Test Equipment The table below summarizes the test equipment needed to perform all of the measurements shown in this guide. Alternate equipment model numbers are given in case the recommended equipment is not available. If neither the recommended nor the alternative test equipment are available, substitute equipment that meets or exceeds the critical specifications listed.
Item Synthesized Sweeper (if 8665B, ESG or PSG is not available) Chapter 4 Critical Specifications Frequency Range: 10 MHz to 6 GHz Power Level: -10 to +5 dBm Recommended Agilent Model Alternate Agilent Model 83620A/B, 83630A/B, 83640A/B, 83650A/B 67 Recommended Test Equipment Recommended Test Equipment Test Equipment for Making Measurements
Recommended Test Equipment Recommended Test Equipment Test Equipment for Making Measurements 68 Chapter 4
Spectrum Analyzer 5 Spectrum Analyzer 69
Spectrum Analyzer This Chapter provides information making the following measurements.
Making a Basic Measurement This section provides information on basic analyzer operation. For more information on making measurements, see the appropriate measurement chapter.
Spectrum Analyzer Spectrum Analyzer Making a Basic Measurement Example: Submenu Displays a new menu of menu keys. A submenu key allows you to view a new menu of menu keys related to the submenu key category. Example: Choice Allows you to make a selection from a list of values. A choice key displays the currently selected submenu choice, in this example, dBm. When the choice is made, the submenu automatically returns. Example: Adjust Press this type of key and enter a value.
Presetting the Spectrum Analyzer Preset provides a known starting point for making measurements. The analyzer has two types of preset: Mode Preset This type of preset restores the currently selected mode to a known factory-defined state. User Preset Restores the analyzer to a user-defined state. User Preset uses the factory-defined state until you create a custom user preset file. For details, see the User’s/Programmer’s manual.
Spectrum Analyzer Spectrum Analyzer Making a Basic Measurement Viewing a Signal 1. Select the spectrum analyzer mode. Press Mode, Spectrum Analyzer. 2. Preset the analyzer: Press Mode Preset. 3. Connect the analyzer’s rear panel REF OUT (10 MHz) to the front-panel input. Setting Center Frequency, Span, Attenuation, and Reference Level. 1. Set the center frequency to 30 MHz: Press FREQ Channel, Center Frequency, 30, MHz. 2. Set the Span to 50 MHz: Press SPAN X Scale, 50, MHz. 3.
Reading Frequency & Amplitude 1. Place a marker (labeled 1) on the 10 MHz peak, as shown in Figure 5-2. Press Peak Search. If necessary, use the menu keys to move the marker to the proper peak. In addition, you can go to the Marker menu (press Marker) and use the knob or arrow keys to move the marker. Note that the frequency and amplitude of the marker appear in the upper-right corner of the screen. 2. If you have moved the marker, return it to the peak of the 10 MHz signal.
Spectrum Analyzer Spectrum Analyzer Making a Basic Measurement Figure 5-3 Relationship Between Frequency and Amplitude 76 Chapter 5
Spectrum Analyzer Measuring Multiple Signals Measuring Multiple Signals This section provides information on measuring multiple signals.
Spectrum Analyzer Measuring Multiple Signals Comparing Signals on the Same Screen Using Marker Delta Using the analyzer, you can easily compare frequency and amplitude differences between signals, such as radio or television signal spectra. The analyzer delta marker function lets you compare two signals when both appear on the screen at one time.
Spectrum Analyzer Measuring Multiple Signals Press Peak Search. The Next Peak menu key is available to move the marker from peak to peak. The marker should be on the 3rd harmonic of the 10 MHz reference signal. Step 6. Anchor the first marker and activate the Delta marker: Press Marker, Delta. The label on the second marker reads ∆1, indicating that it is the movable marker. Step 7. Move the second marker to another signal peak or by using the Peak Search key: Press Peak Search, Next Peak.
Spectrum Analyzer Measuring Multiple Signals Comparing Signals not on the Same Screen Using Marker Delta Measure the frequency and amplitude difference between two signals that do not appear on the screen at one time. (This technique is useful for harmonic distortion tests when narrow span and narrow bandwidth are necessary to measure the low level harmonics.
Spectrum Analyzer Measuring Multiple Signals Press FREQ Channel, CF Step, 10, MHz. Step 7. Activate the marker delta function: Press Marker, Delta. Step 8. Increase the center frequency by 10 MHz: Press FREQ Channel, Center Frequency, ↑, Peak Search. The delta marker (∆1) appears on the peak of the 40 MHz harmonic. The delta marker annotation displays the amplitude and frequency difference between the 30 and 40 MHz signal peaks. Refer to Figure 5-6.
Spectrum Analyzer Measuring Multiple Signals Resolving Signals of Equal Amplitude In this procedure a decrease in resolution bandwidth is used to resolve two signals of equal amplitude with a frequency separation of 100 kHz. Notice that the final RBW selection to resolve the signals is the same width as the signal separation. Step 1.
Spectrum Analyzer Measuring Multiple Signals Figure 5-8 Unresolved Signals of Equal Amplitude Step 4. Change the resolution bandwidth (RBW) to 100 kHz so that the RBW setting is less than or equal to the frequency separation of the two signals: Press BW, Res BW (Manual), 100, kHz. Notice that the peak of the signal has become flattened indicating that two signals may be present.
Spectrum Analyzer Measuring Multiple Signals description in the Agilent CSA Spectrum Analyzers User’s/Programmer’s Reference Guide.) To resolve two signals of equal amplitude, the resolution bandwidth must be less than the signal separation. For example, if the signal separation is 200 kHz and the analyzer only has resolution bandwidth settings in a 1-3-10 sequence, a 100 kHz RBW is the best choice for the 200 kHz signal separation.
Spectrum Analyzer Measuring Multiple Signals Resolving Small Signals Hidden by Large Signals This procedure uses narrow resolution bandwidths to resolve two input signals with a frequency separation of 50 kHz and an amplitude difference of 60 dB. Step 1. Connect two sources to the analyzer input as shown in Figure 5-7. Connect the output of signal generator #1 to port 2 of the directional coupler and connect the output of signal generator #2 to port 3 (the coupled port) of the directional coupler.
Spectrum Analyzer Measuring Multiple Signals Figure 5-11 Signal Resolution with a 100 kHz RBW Step 5. Activate averaging to smooth the noise: Press Meas Setup, Average Mode, Exponential. Press Avg Number, 25, Enter. Press Trace/Detector, Average Step 6. Reduce the resolution bandwidth filter to view the smaller hidden signal. Place a delta marker on the smaller signal: Spectrum Analyzer Press BW, 30, kHz. Press Peak Search, Marker, Delta, 450, kHz.
Spectrum Analyzer Measuring Multiple Signals NOTE To determine the resolution capability for intermediate amplitude differences, assume the filter skirts between the 3 dB and 60 dB points are parabolic, like an ideal Gaussian filter. The resolution capability is approximately: ∆f 2 12.04 dB • ⎛ -------------⎞ ⎝ RBW⎠ where ∆f is the separation between the signals.
Spectrum Analyzer Measuring a Low−Level Signal Measuring a Low−Level Signal This section provides information on measuring low-level signals and distinguishing them from spectrum noise. This chapter is divided into the following sections: “Reducing Input Attenuation” on page 89 “Decreasing the Resolution Bandwidth” on page 91 “Trace Averaging” on page 93 CAUTION Ensure that the total power of all signals at the analyzer input does not exceed +33 dBm (2 watts).
Spectrum Analyzer Measuring a Low−Level Signal Reducing Input Attenuation The ability to measure a low-level signal is limited by internally generated noise in the spectrum analyzer. The measurement setup can be changed in several ways to improve the analyzer sensitivity. The input attenuator affects the level of a signal passing through the instrument. If a signal is very close to the noise floor, reducing input attenuation can bring the signal out of the noise.
Spectrum Analyzer Measuring a Low−Level Signal Press Meas Setup, Avg Number, 10, Enter. Press Avg Mode, Exponential. Press Trace/Detector, Average. Step 8. To see the signal more clearly, set the attenuation to 0 dB: Press AMPTD Y Scale, Elect Atten, 0, dB. Figure 5-14 shows 0 dB input attenuation. Figure 5-14 Measuring a Low-Level Signal Using 0 dB Attenuation Step 9. Set the attenuation to 20 dB: (as shown in Figure 5-15) Press AMPTD Y Scale, Elec Atten, 20, dB.
Spectrum Analyzer Measuring a Low−Level Signal Decreasing the Resolution Bandwidth Resolution bandwidth settings affect the level of internal noise without affecting the level of continuous wave (CW) signals. Decreasing the RBW by a decade reduces the noise floor by 10 dB. Step 1. Connect the RF Output of the signal generator to the analyzer RF Input as shown in Figure 5-7. Figure 5-16 Setup for Obtaining One Signal Step 2. Set the frequency of the signal source to 295 MHz.
Spectrum Analyzer Measuring a Low−Level Signal Figure 5-17 Decreasing Resolution Bandwidth RBW Selections You can use the step keys to change the RBW in a 1−3−10 sequence. Spectrum Analyzer All Agilent CSA RBWs are digital. Refer to the Agilent Technologies Specifications Guide to determine the selectivity ratio for the particular RBW of interest. Choosing the next lower RBW for better sensitivity increases the sweep time.
Spectrum Analyzer Measuring a Low−Level Signal Trace Averaging Averaging is a digital process in which each trace point is averaged with the previous average for the same trace point. Trace averaging can facilitate identifying and characterizing a CW or narrowband signal, such as a carrier or tone in the presence of noise or other broadband signals. Selecting averaging, when the analyzer is auto coupled, changes the detection mode from peak to average, smoothing the displayed noise level. Step 1.
Spectrum Analyzer Measuring a Low−Level Signal more visible. Avg: Exponential (100/100) appears above the graticule. Step 7. With the average number as the active function, set the number of averages to 25: Press Meas Setup, Avg Number, 25, Enter. Annotation above the graticule shows the type of averaging, the number of traces averaged, and the number of averages selected. Changing most active functions restarts the averaging, as does toggling Trace Type back and forth from Clear Write to Average.
Making Distortion Measurements This section provides information on measuring and identifying signal distortion. This section is divided into the following sections: “Identifying Distortion Products” on page 96 “Third-Order Intermodulation Distortion” on page 99 CAUTION Ensure that the total power of all signals at the analyzer input does not exceed +33 dBm (2 watts).
Spectrum Analyzer Spectrum Analyzer Making Distortion Measurements Identifying Distortion Products Distortion from the Analyzer High level input signals may cause analyzer distortion products that could mask the real distortion measured on the input signal. Using trace 2 and the RF attenuator, you can determine which signals, if any, are internally generated distortion products.
Your display should be similar to Figure 5-20. Figure 5-20 Harmonic Distortion with 0 dB Attenuation Step 10. To determine whether the harmonic distortion products are generated by the analyzer, first save the screen data in trace 2 as follows: Press Trace/Detector, Select Trace (2), then Clear Write. Allow the trace to update (two sweeps) and press Trace/Detector, Update Off (View), Marker, Delta. The analyzer display shows the stored data in trace 2 and the measured data in trace 1. Step 11.
Spectrum Analyzer Spectrum Analyzer Making Distortion Measurements Figure 5-21 RF Attenuation of 10 dB Step 12. Press Peak Search, Marker, Delta Change the attenuation to 15 dB by pressing AMPTD Y Scale, Elec Atten, 15, dB. If the ∆Mkr1 amplitude absolute value is approximately ≥1 dB as seen in Figure 5-22, then more input attenuation is required; some of the measured distortion is internally generated. If there is no change in the signal level, the distortion is not generated internally.
Third-Order Intermodulation Distortion Two-tone, third-order intermodulation distortion is a common test in communication systems. When two signals are present in a non-linear system, they can interact and create third-order intermodulation distortion products that are located close to the original signals. These distortion products are generated by system components such as amplifiers and mixers. This procedure tests a device for third-order intermodulation using markers.
Spectrum Analyzer Spectrum Analyzer Making Distortion Measurements Step 2. Set the signal sources as follows: Set signal generator #1 to 295 MHz at –5 dBm. Set signal generator #2 to 296 MHz at 11 dBm (this higher power level overcomes the nominal 16 dB loss through the coupled arm of the directional coupler). This will result in a frequency separation of 1 MHz. The amplitude of both signals should be approximately −5 dBm at the output of the bridge. Step 3.
Figure 5-24 Measuring the Distortion Product Chapter 5 101 Spectrum Analyzer Spectrum Analyzer Making Distortion Measurements
Spectrum Analyzer Using the Analyzer as a Fixed Tune Receiver Using the Analyzer as a Fixed Tune Receiver This section provides information on using the analyzer as an AM receiver to measure modulation parameters. This section includes the following measurement: “Measuring the Modulation Rate of an AM Signal” on page 102 Ensure that the total power of all signals at the analyzer input does not exceed +33 dBm (2 watts).
Spectrum Analyzer Using the Analyzer as a Fixed Tune Receiver and turn AM on. Step 3. Select the spectrum analyzer mode: Press Mode, Spectrum Analyzer. Step 4. Preset the analyzer. Press Mode Preset. Step 5. Set the center frequency, span, RBW and the sweep time. Press FREQ Channel, Center Frequency, 300, MHz. Press SPAN X Scale, Span, 500, kHz. Press BW, Res BW, 30, kHz. Step 6. Set the y-axis units to volts: Press AMPTD Y Scale, More, Y-Axis Units, Volts. Step 7.
Spectrum Analyzer Using the Analyzer as a Fixed Tune Receiver difference between adjacent peaks (this is the AM rate of the signal) NOTE Make sure the delta markers above are placed on adjacent peaks. See Figure 5-26. The frequency or the AM rate is 1 divided by the time between adjacent peaks: AM Rate = 1/1.0 ms = 1 kHz Figure 5-26 Measuring Time Parameters Spectrum Analyzer N You can also use the marker inverse time readout to calculate AM rate in Hz.
Spectrum Analyzer Occupied Bandwidth (OBW) Measurement Occupied Bandwidth (OBW) Measurement Occupied Bandwidth integrates the power of the displayed spectrum and puts markers at the frequencies between which a selected percentage of the power is contained. The measurement defaults to 99% of the occupied bandwidth power. The power-bandwidth routine first computes the combined power of all signal responses contained in the trace.
Spectrum Analyzer Occupied Bandwidth (OBW) Measurement Making a Basic Occupied BW Measurement For accurate OBW measurements, it is recommended that you use the sample or average trace detectors. The default detector type is sample. In addition, you should use Exponential Average or Repeat Average with 100 or more averages. NOTE The following example shows how to make an OBW measurement on a GSM signal broadcasting at 950 MHz. Step 1.
Spectrum Analyzer Occupied Bandwidth (OBW) Measurement Figure 5-28 OBW Measurement Results Step 7. You can improve the repeatability of the measurements by setting the Average number to 100 or greater: Press Meas Setup, Avg Number, 100, Enter, Trace/Detector, Average. Step 8. You can change the percentage of power used for calculating the Occupied BW. The default percentage is 99%.: Press Meas Setup, Power, 80, %.
Spectrum Analyzer Spectrum Analyzer Occupied Bandwidth (OBW) Measurement 108 Chapter 5
Channel Analyzer Measurements 6 Channel Analyzer Measurements 109
Channel Analyzer Measurements This chapter provides information on measuring signal power. This chapter includes the following measurement: “Making Adjacent Channel Power (ACP) Measurements” on page 111 CAUTION Ensure that the total power of all signals at the analyzer input does not exceed +33 dBm (2 watts).
Channel Analyzer Measurements Making Adjacent Channel Power (ACP) Measurements Making Adjacent Channel Power (ACP) Measurements The adjacent channel power (ACP) measurement is also referred to as the adjacent channel power ratio (ACPR) and adjacent channel leakage ratio (ACLR). We use the term ACP to refer to this measurement. ACP measures the total power (rms voltage) in the specified channel and up to three pairs of offset frequencies.
Channel Analyzer Measurements Making Adjacent Channel Power (ACP) Measurements Figure 6-1 Setup for ACP Measurement Step 2. Using an ESG, setup a W-CDMA signal transmitting at 1.955 GHz and −10 dBm. Step 3. Select the channel analyzer mode and the adjacent channel power measurement: Press Mode, Channel Analyzer, Adjacent Channel Power. Step 4. Preset the analyzer. Press Mode Preset. Channel Analyzer Measurements Step 5. Set the center frequency to 1.955 GHz: Press FREQ Channel, Center Freq, 1.
Channel Analyzer Measurements Making Adjacent Channel Power (ACP) Measurements Figure 6-2 ACP Measurement Results The frequency offsets, channel integration bandwidths, and span settings can all be modified when you select Meas Setup, Format Type (Cust). Step 7. Turn the limit test on: Press Meas Setup, Limits, Power Limits, Power Limits (On). Figure 6-3 ACP Results with Offset Limits Step 8.
Channel Analyzer Measurements Making Adjacent Channel Power (ACP) Measurements Press Meas Setup, Limits, Power Limits, Center Chan High Limit, −10, dBm, Center Chan Low Limit, −25, dBm, Adj Chan 1 High Limit, −35, dB, and Adj Chan 2 High Limit, −65, dB. In Figure 6-4 notice that ACP 2 Low and ACP 2 High have both failed, however all other channels have passed.
Stimulus Response Measurements (Option N8995A) 115 Stimulus Response Measurements (Option N8995A) 7
Stimulus Response Measurements (Option N8995A) This chapter provides information on measuring signal loss in cables and devises and making cable fault measurement. This chapter is divided into the following sections: “Two Port Insertion Loss” on page 117 “One Port Insertion Loss” on page 120 “Return Loss” on page 123 “Distance to Fault” on page 125 CAUTION Ensure that the total power of all signals at the analyzer input does not exceed +33 dBm (2 watts).
Stimulus Response Measurements (Option N8995A) Two Port Insertion Loss Two Port Insertion Loss This procedure measures the loss or gain of a filter, amplifier, cable, or other devices over a specified frequency range. Insertion loss measurements are important in accurately quantifying the amount of loss or gain a signal will incur as it passes through a device. In S-parameter terms, insertion loss is referred to as an S21 measurement. “S” stands for scattering.
Stimulus Response Measurements (Option N8995A) Two Port Insertion Loss Step 7. Connect the cable (but not the DUT) from the tracking generator output to the analyzer input as shown in Figure 7-1. Figure 7-1 Two Port Insertion Loss Normalization Test Setup Step 8. Normalize the frequency response: Press FREQ Channel, Normalize and follow the instructions on the Normalize Wizard. Step 9.
Stimulus Response Measurements (Option N8995A) Two Port Insertion Loss In this example, the attenuation over this frequency range is 60.7 dB/octave (one octave above the cutoff frequency). Step 12. Use the front-panel knob to place the marker at the highest peak in the stop band to determine the minimum stop band attenuation. In this example, the peak occurs at 90.47 MHz. The attenuation is 57.6 dB.
Stimulus Response Measurements (Option N8995A) One Port Insertion Loss One Port Insertion Loss The one port insertion loss measurement allows you to quantify signal loss in a cable or other device without connecting both ends to the analyzer. This measurement can be especially useful in measuring the loss of a feedline connected to the antenna on a tower. This measurement is less accurate than two port insertion loss, however.
Stimulus Response Measurements (Option N8995A) One Port Insertion Loss Figure 7-4 One Port Insertion Loss Measurement Step 2. Set the analyzer to the One Port Insertion Loss measurement: Press Mode, Stimulus/Response, One Port Insertion Loss Step 3. Preset the analyzer: Press Mode Preset, Meas, One Port Insertion Loss. Step 4. Set the start and stop frequencies: Press FREQ Channel, Start Freq, 100, MHz. Press FREQ Channel, Stop Freq, 2, GHz. Step 5.
Stimulus Response Measurements (Option N8995A) One Port Insertion Loss Stimulus Response Measurements (Option N8995A) Figure 7-5 One Port Insertion Loss Measurement Results, Normalized.
Stimulus Response Measurements (Option N8995A) Return Loss Return Loss Return loss is a measure of reflection characteristics. One way you can use the return loss measurement is to detect problems in an antenna feedline system or the antenna itself. A portion of the incident power will be reflected back to the source from each transmission line fault as well as the antenna. The ratio of the reflected voltages to the incident voltage is called the reflection coefficient.
Stimulus Response Measurements (Option N8995A) Return Loss frequency range. Step 6. Connect the test cable (if used) and calibration devices to the analyzer RF Output, as shown in Figure 7-6, or in the calibration wizard. (If the DUT is a two-port device, be sure to terminate the unused port in the characteristic impedance of the device.) Note that the units of the reference level are dB, indicating that this is a relative measurement. This example uses a 50 MHz low pass filter as the DUT.
Stimulus Response Measurements (Option N8995A) Distance to Fault Distance to Fault A signal is transmitted from the RF Output connector of the analyzer to the cable-under-test. The signals reflected from faults in the cable are received by the analyzer. In performing this measurement, the analyzer uses frequency domain reflectometry. The changing interference of the transmitted and reflected signals contains information about the distance to one or more faults.
Stimulus Response Measurements (Option N8995A) Distance to Fault NOTE Test signals can cause interference. When testing cables attached to antennas, test signals are radiated. Verify that the signal used for the test cannot cause interference to another antenna. NOTE The Distance to Fault calibration for manual frequency range is the same calibration as performed for the Return Loss.
Stimulus Response Measurements (Option N8995A) Distance to Fault Press FREQ Channel, Units (Meters or Feet). Each time you press this menu key, the selected option changes. Step 7. Calibrate the measurement: Press FREQ Channel, Calibrate and follow the instructions on the Calibration Wizard. The analyzer will calibrate over the desired frequency range. Figure 7-8 Distance to Fault Measurement, Calibrated Step 8.
Stimulus Response Measurements (Option N8995A) Distance to Fault Stimulus Response Measurements (Option N8995A) Figure 7-10 Distance to Fault Measurement Results.
Concepts 8 Concepts 129
Concepts Concepts Resolving Closely Spaced Signals Resolving Closely Spaced Signals Resolving Signals of Equal Amplitude Two equal-amplitude input signals that are close in frequency can appear as a single signal trace on the analyzer display. Responding to a single-frequency signal, a swept-tuned analyzer traces out the shape of the selected internal IF (intermediate frequency) filter (typically referred to as the resolution bandwidth or RBW filter).
Concepts Resolving Closely Spaced Signals When dealing with the resolution of signals that are close together and not equal in amplitude, you must consider the shape of the IF filter of the analyzer, as well as its 3 dB bandwidth. (See “Resolving Signals of Equal Amplitude” on page 130 for more information.) The shape of a filter is defined by the selectivity, which is the ratio of the 60 dB bandwidth to the 3 dB bandwidth.
Concepts Concepts Trigger Concepts Trigger Concepts Trigger functions are only available when the Agilent CSA is in zero span. In non-zero spans, the Agilent CSA is always in Free Run. Selecting a Trigger 1. Video Triggering Video triggering controls the sweep time based on the detected envelope signal to steady the signal on the display.
Concepts AM and FM Demodulation Concepts Concepts AM and FM Demodulation Concepts Demodulating an AM Signal Using the Analyzer as a Fixed Tuned Receiver (Time-Domain) The zero span mode can be used to recover amplitude modulation on a carrier signal. The following functions establish a clear display of the waveform: • Triggering stabilizes the waveform trace by triggering on the modulation envelope.
Concepts Concepts Stimulus Response Measurement Concepts Stimulus Response Measurement Concepts NOTE Stimulus response measurements require the N8995A Stimulus Response Measurement Suite and either option TG3 or TG6. Stimulus Response Overview Stimulus response measurements require a source to stimulate a device under test (DUT), a receiver to analyze the frequency response characteristics of the DUT, and, for return loss measurements, a directional coupler or bridge.
Concepts Stimulus Response Measurement Concepts To make a reflection measurement accurately, it is necessary to perform an open/short/load calibration. An open, short, and load are included in the Stimulus Response Calibration Kit, Option SRK. Press Mode, Stimulus/Response, Return Loss. Set the desired start and stop frequencies. Press Calibrate and follow the instructions. After the calibration is complete, connect the DUT to the RF OUTPUT connector to make your return loss measurement.
Concepts Concepts Stimulus Response Measurement Concepts 136 Chapter 8
Programming Examples 9 Programming Examples 137
Programming Examples Finding Examples and More Information Finding Examples and More Information The latest version of programming examples are available from the following URL: http://www.agilent.com/find/saprogramming Programming Examples Interchangeable Virtual Instruments COM (IVI-COM) drivers: Develop system automation software easily and quickly.
Programming Examples Programming Examples Information and Requirements Programming Examples Information and Requirements • The programming examples were written for use on an IBM compatible PC. • The programming examples use C, Visual Basic and VEE programming languages. • The programming examples use the LAN interface. The VISA transition library must be installed and the GPIB card configured. The Agilent I/O libraries contain the latest VISA library and is available at: www.agilent.
Programming Examples Programming in C Using the VISA Programming in C Using the VISA The C programming examples that are provided are written using the C programming language and the Agilent (VISA library). This section includes some basic information about programming in the C language. Note that some of this information may not be relevant to your particular application. (For example, if you are not using VXI instruments, the VXI references will not be relevant).
Programming Examples Programming in C Using the VISA Typical Example Program Contents The following is a summary of the VISA function calls used in the example programs. visa.h This file is included at the beginning of the file to provide the function prototypes and constants defined by VISA. ViSession The ViSession is a VISA data type. Each object that will establish a communication channel must be defined as ViSession.
Programming Examples Programming in C Using the VISA Linking to VISA Libraries Your application must link to one of the VISA import libraries: 32-bit Version: C:\VXIPNP\WIN95\LIB\MSC\VISA32.LIB for Microsoft compilers C:\VXIPNP\WIN95\LIB\BC\VISA32.LIB for Borland compilers 16-bit Version: C:\VXIPNP\WIN\LIB\MSC\VISA.LIB for Microsoft compilers Programming Examples C:\VXIPNP\WIN\LIB\BC\VISA.
Programming Examples Programming in C Using the VISA 6. Click on the Add button and type in the following: C:\VXIPNP\WIN95\LIB\MSC For Borland C++ version 4.0 compilers: • You may wish to add the include file and library file search paths. They are set under the Options | Project menu selection. Double click on Directories from the Topics list box and add the following: C:\VXIPNP\WIN95\INCLUDE C:\VXIPNP\WIN95\LIB\BC 16-bit Applications For Microsoft Visual C++ version 1.
Programming Examples Programming in C Using the VISA Example Program This example program queries a LAN device for an identification string and prints the results. Note that you must change the address. /*idn.c - program filename */ #include "visa.h" #include void main () { Programming Examples /*Open session to LAN device at IP address 192.168.0.2 */ ViOpenDefaultRM (&defaultRM); ViOpen (defaultRM, "TCPIP0::192.168.0.
Programming Examples Programming in C Using the VISA Opening a Session A session is a channel of communication. Sessions must first be opened on the default resource manager, and then for each device you will be using. The following is a summary of sessions that can be opened: • A resource manager session is used to initialize the VISA system. It is a parent session that knows about all the opened sessions. A resource manager session must be opened before any other session can be opened.
Programming Examples Programming in C Using the VISA The session returned from viOpenDefaultRM must be used in the sesn parameter of the viOpen function. The viOpen function then uses that session and the device address specified in the rsrcName parameter to open a device session. The vi parameter in viOpen returns a session identifier that can be used with other VISA functions.
Programming Examples Programming in C Using the VISA devices. Addressing a Session As seen in the previous section, the rsrcName parameter in the viOpen function is used to identify a specific device. This parameter is made up of the VISA interface name and the device address. The interface name is determined when you run the VISA Configuration Utility. This name is usually the interface type followed by a number.
Programming Examples Programming in C Using the VISA XI0::24::INSTR Device at VXI logical address 24 that is of VISA type INSTR. VXI2::128 Device at VXI logical address 128, in the third VXI system (VXI2). GPIB-VXI0::24 A VXI device at logical address 24. This VXI device is connected via a GPIB-VXI command module. Programming Examples GPIB0::7::0 A GPIB device at primary address 7 and secondary address 0 on the GPIB interface. TCPIP::devicename@company.
Basic System Operations 10 Basic System Operations 149
Basic System Operations This chapter contains information on the following Basic System Operations: “System Reference Introduction” on page 151 “Setting System References” on page 152 “Selecting a Frequency/Timing Reference” on page 152 “Printing a Screen To a File” on page 153 “Printing Screens” on page 153 “File Naming Options” on page 155 “Saving Data” on page 154 “Saving Data” on page 154 “Managing Media Types” on page 157 “Configuring for Network Connectivity” on page 158 “Saving, Recalling, and Delet
Basic System Operations System Reference Introduction System Reference Introduction The N1996A Agilent CSA spectrum analyzers provide a system utility that allows you to perform non-measurement activities and to configure the analyzer for: • General operations • System status updates • Data manipulation • Basic system functions testing Basic System Operations Chapter 10 151
Basic System Operations Setting System References Setting System References The Agilent CSA provide a utility to preconfigure the global settings for the box. Selecting a Frequency/Timing Reference Perform this procedure to select a common frequency or timing reference to be used for all measurement tools (when applicable). 1. Press System, Freq/Time Reference 2. Using the knob or the up/down arrow navigation keys to highlight the frequency/timing reference you want. 3. Press Select.
Basic System Operations Printing a Screen To a File Printing a Screen To a File The N1996A lets you save screen images to PNG files. You can save the image files to a USB mass storage device. Printing Screens 1. Display data on a measurement screen. 2. Connect a USB mass storage device. 3. Select how you want to name the data file you’re saving (see “File Naming Options” on page 155). This step must only be performed prior to the first time you save a file, or if you want to change the method you use. 4.
Basic System Operations Saving Data Saving Data Saving Data You may save and manage data on an external storage device or the internal analyzer drive. You can save the current screen image, the current analyzer state, current trace data, and measurement results. To save data: 1. Display data on a measurement screen. 2. Press Save, Type and select the type of data you want to save. 3. If you have selected a data type of Trace, press Source, and select the trace for the data you want to save.
Basic System Operations File Naming Options File Naming Options You have three options for naming image files. You can: • Name each file automatically using this format: saveData_YYYYMMDD_HHMMSS.png. In this example, the “.png” extension is only for Data Type set to Screen. Other Data Type have other extensions • Name each file individually, and enter the name you want. This is called User file naming. • Have the analyzer ask you how you want to name each file for each file you save.
Basic System Operations File Naming Options • Overwrite—overwrites existing file data with new file data. • Prompt—prompts you to input a new file name. • Auto Incr—automatically increments the filename and retains the existing filename. • Timestamp—attaches a timestamp to the filename to distinguish it from the existing file. Setting Up Asking For Filename You can choose to have the analyzer ask you to name the file you wish to save or print. For every file you save, you enter the filename you want. 1.
Basic System Operations Managing Media Types Managing Media Types The N1996A is compatible with USB flash drive media for storing and retrieving data. The media type buttons are not active until a media device is inserted and recognized by the N1996A. Upon proper recognition, the analyzer allows you to perform basic media tasks with each media type.
Basic System Operations Configuring for Network Connectivity Configuring for Network Connectivity The N1996A can operate as a device on any compatible network. Therefore, in order to be accessible on the network, certain information must be entered so the analyzer can communicate with other devices. Configuring the analyzer for network activity is performed by using the IP administrator located in the system utilities.
Basic System Operations Configuring for Network Connectivity information for the analyzer to be recognized. Contact your network administrator if you do not have this information. 5. Press IP Address. 6. Enter the IP address using the knob or the up and down arrows, and menu keys on the left. 7. Press Ok 8. Press Net Mask 9. Enter the Net Mask using the knob or the up and down arrows, and menu keys on the left. 10. Press Ok 11. Press Gateway 12.
Basic System Operations Saving, Recalling, and Deleting Instrument States Saving, Recalling, and Deleting Instrument States You can save the current configuration and settings for recall at a later time. You can also save a customized power-up state, which the analyzer will use each subsequent time it is powered on. This enables you to configure common usage and power-on states to make measurements quickly. Saving the State 1. Configure all measurement settings you want to save.
Basic System Operations Saving, Recalling, and Deleting Instrument States This step must only be performed prior to the first time you recall a file, or if you want to change the file recall location. 3. If you have selected USB as the recall location, connect the USB mass storage device. 4. If necessary, select how you want the state files sorted by pressing Sort and then press By Date, By Name, By Extension, Size, or Order. 5. Press Recall Now. 6.
Basic System Operations Saving, Recalling, and Deleting Instrument States Deleting States If you have saved a state you will no longer use, you can delete it. 1. Press Recall, Type, State, Device (Internal), Catalog. 2. Select from the file list the state file you want to delete using the knob or up and down arrow buttons or All to delete all saved states. All states, in addition to two supplied in the analyzer (listed below), are displayed.
Basic System Operations Viewing System Statistics Viewing System Statistics The N1996A provides the ability view system statistics: • “Viewing System Release Versions” on page 163 • “Viewing System Memory” on page 163 • “Viewing Battery Statistics” on page 163 Viewing System Release Versions Perform this procedure to view the current version of software and firmware for enabled features. 1. Press System, System Stats, Rev Info, and view version information for system firmware. 2.
Basic System Operations Using the Option Manager Using the Option Manager The N1996A provides a utility that allows you to: • “Viewing Installed Options” on page 164 • “Viewing Installable Options” on page 164 • “Installing an Option” on page 164 • “Viewing Installation Information” on page 164 Viewing Installed Options 1. Press System, Option Manager, Installed Options. This provides a list of all installed options as well as their associated license keys. 2.
Basic System Operations Testing System Functions Testing System Functions The N1996A provides two simple tests you can perform to test the basic system functionality: a display test and a keyboard test. Testing Your Display Perform this procedure to verify the correct operation of your display. 1. Press System, Service, Verification, Display Test. 2. Follow the on-screen instructions. Testing Your Keyboard Perform this procedure to verify the correct operation of your keyboard device. 1.
Basic System Operations Basic System Operations Testing System Functions 166 Chapter 10
11 Working with Batteries Working with Batteries 167
Working with Batteries This chapter contains the following topics on your Agilent CSA batteries: “Installing Batteries” on page 169 “Viewing Battery Status” on page 170 “Charging Batteries” on page 172 “Recalibrating Batteries” on page 174 “Battery Care” on page 175 Working with Batteries “Battery Specifications” on page 178 168 Chapter 11
Working with Batteries Installing Batteries Installing Batteries 1. Open the battery door by turning the latch counterclockwise several times until loose. Then pull the battery door open. 2. Insert two batteries. Both batteries must be installed for the instrument to operate properly. 3. Close the battery door and turn the latch clockwise until tight to secure the battery door.
Working with Batteries Viewing Battery Status Viewing Battery Status You can view information about battery status in four ways: • Two battery LEDs on the analyzer front panel (below the USB connectors, refer to “Front-Panel Connectors and Keys” on page 52) • Icons in the lower right of the front panel screen • System Statistics—Battery screen, available from the System menu • LCD gauge built into each battery Battery LEDs NOTE LED Charge remaining Green Greater than or equal to 25% charge capacity
Working with Batteries Viewing Battery Status Battery screen displays several kinds of information: • Temperature—the internal temperature of each battery as measured by a sensor embedded in each battery • Voltage—for each battery cell stack as measured by each battery’s sensor • Run Time to Empty—while using external power, External DC Power is displayed; while using battery power, the predicted remaining battery run time is displayed in minutes at the present rate of discharge.
Working with Batteries Charging Batteries Charging Batteries You can charge batteries internally or using the external battery charger (Option BCG). The external charger provides much faster charging time. CAUTION Charge batteries internally or with the appropriate charger, an SMBus charger of level II or higher. Never use a non-SMBus charger because the battery issues commands over the SMBus to the charger to control the charge rate and voltage. Never use a modified or damaged charger.
Working with Batteries Charging Batteries External Battery Charger LED Charging Status Green on Charging complete Green flashing Charging Blue flashing Calibrating—the accuracy of the battery’s internal LCD charge gauge is being renewed. Refer to “Recalibrating Batteries” on page 174.
Working with Batteries Recalibrating Batteries Recalibrating Batteries Each battery contains a microchip that monitors battery usage and tracks how much capacity is available. This function can become less accurate because of temperature fluctuations, aging, self-discharge, repeated partial charging, and other factors. This inaccuracy is displayed on the System Statistics—Battery screen as Fuel Gauge Error.
Working with Batteries Battery Care Battery Care WARNING Lithium Ion and lithium polymer cells and battery packs may get hot, explode, or ignite and cause serious injury if exposed to abuse conditions. Be sure to follow these safety warnings: • Do not install the battery backward, so the polarity is reversed. • Do not connect the positive terminal and negative terminal of the battery to each other with any metal object (such as wire).
Working with Batteries Battery Care WARNING Do not discharge the battery using any device except the specified device. When the battery is used in devices other than the specified device, it may damage the battery or reduce its life expectancy. If the device causes an abnormal current to flow, it may cause the battery to become hot, explode, or ignite and cause serious injury.
Working with Batteries Battery Care battery electronics go into shutdown mode. When a battery has discharged down to 7.1 volts, it goes into shutdown mode. When this occurs, the battery electronics self-disconnect, removing their electronic load from the cells. This provides approximately 1 year of room temperature storage before the cells self-discharge to the point beyond which they should not be recharged.
Working with Batteries Battery Specifications Battery Specifications The N1996A Agilent CSA Series Spectrum Analyzer uses the Inspired Energy NF2040HD24 Smart Battery, which produces 10.8 volts DC at approximately 6 A. The NF2040HD24 is a Lithium Ion battery pack, which uses the System Management Bus (SMBus) interface to communicate with the analyzer and charger. To charge the batteries, use only the Agilent approved SMBus charger of Level II or higher or the N1996A.
Working with Batteries Battery Specifications Option BCG NOTE Description Part Number Dual Battery Charger 0950-4776 Replace only with NF2040HD24 or equivalent, Agilent-approved battery. Additional batteries are also available directly from Inspired Energy, Inc. To purchase additional or replacement batteries, visit www.inspired-energy.com, or call toll free USA 1-888-5-INSPIRE (546-7747).
Working with Batteries Working with Batteries Battery Specifications 180 Chapter 11
Connector Care 12 Connector Care 181
Connector Care Connector Care This chapter contains the following topics on care of your Agilent CSA connectors: “Using, Inspecting, and Cleaning RF Connectors” on page 183 “Repeatability” on page 183 “RF Cable and Connector Care” on page 183 “Proper Connector Torque” on page 184 “Connector Wear and Damage” on page 184 “Cleaning Procedure” on page 185 182 Chapter 12
Connector Care Using, Inspecting, and Cleaning RF Connectors Connector Care Using, Inspecting, and Cleaning RF Connectors Taking proper care of cables and connectors will protect the ability of your analyzer to make accurate measurements. Inaccurate measurements often result from improperly made connections or dirty or damaged connectors. Worn, out-of-tolerance, or dirty connectors degrade the accuracy and repeatability of measurements.
Connector Care Connector Care Using, Inspecting, and Cleaning RF Connectors • Never bend a cable at a sharp angle. • Do not bend cables near the connectors. • If any of the cables will be flexed repeatedly, buy a back-up cable. This will allow immediate replacement and will minimize your analyzer’s down time. Before Connecting the Cables to Any Device: • Check all connectors for wear or dirt. • When making the connection, torque the connector to the proper value.
Connector Care Using, Inspecting, and Cleaning RF Connectors Connector Care Cleaning Procedure 1. Blow particulate matter from connectors using an environmentally-safe aerosol such as Ultrajet. This product is recommended by the United States Environmental Protection Agency and contains chlorodifluoromethane. 2. Use an alcohol wipe to wipe connector surfaces. Wet a small swab with alcohol (from the alcohol wipe) and clean the connector with the swab. 3.
Connector Care Connector Care Using, Inspecting, and Cleaning RF Connectors 186 Chapter 12
In Case of Difficulty 13 In Case of Difficulty This chapter includes information on how to check for a problem with your Agilent Technologies spectrum analyzer, and how to return it for service.
In Case of Difficulty If you experience a problem or would like additional information about your analyzer, Agilent Technologies’ worldwide organization is ready to provide the support you need. Before calling Agilent Technologies, however (or returning an analyzer for service), perform the quick checks listed in “Check the Basics” on page 190. This check may eliminate the problem. If a problem persists, you may choose to: • Repair the analyzer yourself. See “Service Options” on page 191.
In Case of Difficulty Types of Spectrum Analyzer Messages Types of Spectrum Analyzer Messages The analyzer can generate various messages that appear on the display during operation. For a complete list of spectrum analyzer messages, see the Instrument Messages and Functional Tests manual. The following table describes the three types of spectrum analyzer messages. Table 13-1 Types of Messages Location Notes Informational messages typically provide verification that an action has occurred.
In Case of Difficulty Before Calling Agilent Technologies Before Calling Agilent Technologies Check the Basics ❏ Is there power at the receptacle? ❏ Is the analyzer turned on? Check to see if the green LED above the power switch is on. Also, listen for internal fan noise to determine if the analyzer cooling fan is running. In Case of Difficulty ❏ If other equipment, cables, and connectors are being used with your spectrum analyzer, make sure they are connected properly and operating correctly.
In Case of Difficulty Before Calling Agilent Technologies Read the Warranty The warranty for your analyzer is in the front of your Specifications Guide. Please read it and become familiar with its terms. If your analyzer is covered by a separate maintenance agreement, please be familiar with its terms. Service Options Agilent Technologies offers several optional maintenance plans to service your analyzer after the warranty has expired. Call your Agilent Technologies office for full details.
In Case of Difficulty Before Calling Agilent Technologies Table 13-2 Contacting Agilent Technologies In Case of Difficulty Online assistance: http://www.agilent.
In Case of Difficulty Returning an Analyzer for Service Returning an Analyzer for Service NOTE Please notify Agilent Technologies before returning your system for service. Any special arrangements for the system can be discussed at this time. This will help Agilent Technologies repair and return your system as quickly as possible. NOTE For specific analyzer packing instructions, refer to “Preparing the Analyzer for Shipping” on page 195.
In Case of Difficulty Returning an Analyzer for Service • List of any accessories returned with the system Packaging CAUTION Cover electrical connectors to protect sensitive components from electrostatic damage. In Case of Difficulty Spectrum analyzer damage can result from using packaging materials other than the original materials. Never use styrene pellets in any shape as packaging materials. They do not adequately cushion the equipment or prevent it from shifting in the carton.
In Case of Difficulty Returning an Analyzer for Service Preparing the Analyzer for Shipping 1. Attach a completed service tag to the analyzer. Refer to “Service Tag” on page 193. 2. Pack the system in the original shipping containers. Original materials are available through Agilent Technologies office. 3. Wrap the system in anti-static plastic to reduce the possibility of damage caused by electrostatic discharge. 4. Seal the carton with strong nylon adhesive tape. 5.
In Case of Difficulty In Case of Difficulty Returning an Analyzer for Service 196 Chapter 13
Copyright Information 14 Copyright Information 197
Copyright Information Where to Find Additional Copyright Information Additional Copyright information is available on the Documentation CD-ROM and in the front matter of this manual. © Copyright 1999 The Apache Software Foundation™. All rights reserved. The Apache Software License, Version 1.1 Redistribution and use in source and binary forms, with or without modification, are permitted provided that the following conditions are met: 1.
Copyright Information ===================================================== This software consists of voluntary contributions made by many individuals on behalf of the Apache Software Foundation and was originally based on software copyright © 1999, International Business Machines, Inc., http://www.ibm.com. For more information on the Apache Software Foundation, please see http://www.apache.org. © Copyright 1994-2004 Sun Microsystems™, Inc. All Rights Reserved.
Copyright Information Everyone is permitted to copy and distribute verbatim copies of this license document, but changing it is not allowed. GNU GENERAL PUBLIC LICENSE TERMS AND CONDITIONS FOR COPYING, DISTRIBUTION AND MODIFICATION 0. This License applies to any program or other work which contains a notice placed by the copyright holder saying it may be distributed under the terms of this General Public License.
Copyright Information user how to view a copy of this License. (Exception: if the Program itself is interactive but does not normally print such an announcement, your work based on the Program is not required to print an announcement.) These requirements apply to the modified work as a whole.
Copyright Information which the executable runs, unless that component itself accompanies the executable. If distribution of executable or object code is made by offering access to copy from a designated place, then offering equivalent access to copy the source code from the same place counts as distribution of the source code, even though third parties are not compelled to copy the source along with the object code. 4.
Copyright Information or other property right claims or to contest validity of any such claims; this section has the sole purpose of protecting the integrity of the free software distribution system, which is implemented by public license practices.
Copyright Information PERFORMANCE OF THE PROGRAM IS WITH YOU. SHOULD THE PROGRAM PROVE DEFECTIVE, YOU ASSUME THE COST OF ALL NECESSARY SERVICING, REPAIR OR CORRECTION. 12.
Copyright Information making modifications to it. For a library, complete source code means all the source code for all modules it contains, plus any associated interface definition files, plus the scripts used to control compilation and installation of the library. Activities other than copying, distribution and modification are not covered by this License; they are outside its scope.
Copyright Information sections when you distribute them as separate works. But when you distribute the same sections as part of a whole which is a work based on the Library, the distribution of the whole must be on the terms of this License, whose permissions for other licensees extend to the entire whole, and thus to each and every part regardless of who wrote it.
Copyright Information library”. The executable is therefore covered by this License. Section 6 states terms for distribution of such executables. When a “work that uses the Library” uses material from a header file that is part of the Library, the object code for the work may be a derivative work of the Library even though the source code is not. Whether this is true is especially significant if the work can be linked without the Library, or if the work is itself a library.
Copyright Information as long as the modified version is interface-compatible with the version that the work was made with. c) Accompany the work with a written offer, valid for at least three years, to give the same user the materials specified in Subsection 6a, above, for a charge no more than the cost of performing this distribution.
Copyright Information if you do not accept this License. Therefore, by modifying or distributing the Library (or any work based on the Library), you indicate your acceptance of this License to do so, and all its terms and conditions for copying, distributing or modifying the Library or works based on it. 10.
Copyright Information versions of the Lesser General Public License from time to time. Such new versions will be similar in spirit to the present version, but may differ in detail to address new problems or concerns. Each version is given a distinguishing version number.
Copyright Information © Copyright 1998-2004, CEE-J™, Skelmir, LLC. All rights reserved.
Copyright Information Copyright Information 212 Chapter 14
Index Numerics 10 MHz REF OUTPUT 61 50 ohm load 47 50 ohm/75 ohm minimum loss pad 48 75 ohm matching transformer 48 A AC probe 48 accessories 47 50 ohm load 47 50 ohm/75 ohm minimum loss pad 48 75 ohm matching transformer 48 AC probe 48 broadband preamplifiers 48 power splitters 49 RF limiters 49 transient limiters 49 active function 63 address, IP 32 adjacent channel power 111 adjacent channel power measurement 111 adjustment, maintenance, or repair of test set 193 Agilent sales offices 191 Agilent Techno
Index signals low-level, overview 89 off-screen, comparing 80 on-screen, comparing 78 resolving, equal amplitude 82 resolving, small signals hidden by large signals 85 signals, viewing 74 trace averaging 93 EXTERNAL REF INPUT 61 external reference 33 F factory preset, description 73 feet system II feet kit 49 file naming asking for 156 automatic 155 options 155 user 155 finding hidden signals 131 FM demodulation time-domain demodulation, manually calculating 133 frequency/timing reference 152 front panel c
Index R RBW selections 92 rear panel features 61 reconditioning/recalibrating batteries 174 reference level, setting 75 release versions 163 resolution bandwidth adjusting 91 resolving signals 130 resolving signals small signals hidden by large signals 131 resolving two signals equal amplitude 82, 130 resolving, equal amplitude 130 return loss measurement 123 returning the test set for service 187, 193 RF cable and connector care 183 RF connectors 183 RF limiters 49 RF OUT 50 ohm 54 RPG, using 71 creating
Index Index 216