
Technical data


Chapter 5 75
Spectrum Analyzer
Making a Basic Measurement
Spectrum Analyzer
Reading Frequency & Amplitude
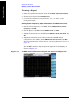
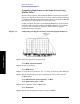
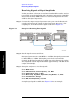
1. Place a marker (labeled 1) on the 10 MHz peak, as shown
in Figure 5-2.
Press
Peak Search. If necessary, use the menu keys to move the
marker to the proper peak. In addition, you can go to the Marker
menu (press Marker) and use the knob or arrow keys to move the
marker.
Note that the frequency and amplitude of the marker appear in the
upper-right corner of the screen.
2. If you have moved the marker, return it to the peak of the 10 MHz
signal.
Figure 5-2 A Marker on the 10 MHz Peak
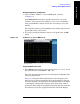
Changing Reference Level
1. Press AMPTD Y Scale, and note that reference level (Ref Level) is now
the active function. Press
Marker ⇒, Mkr ⇒ RL.
Note that changing the reference level changes the amplitude value
of the top graticule line.
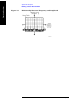
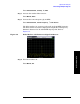
Figure 5-3 shows the relationship between center frequency and
reference level. The box represents the analyzer display. Changing
the center frequency changes the horizontal placement of the signal
on the display. Changing the reference level changes the vertical
placement of the signal on the display. Increasing the span increases
the frequency range that appears horizontally across the display.