
Technical data


78 Chapter 5
Spectrum Analyzer
Measuring Multiple Signals
Spectrum Analyzer
Comparing Signals on the Same Screen Using Marker
Delta
Using the analyzer, you can easily compare frequency and amplitude
differences between signals, such as radio or television signal spectra.
The analyzer delta marker function lets you compare two signals when
both appear on the screen at one time.
In this procedure, harmonics of the 10 MHz reference signal available
at the rear of the analyzer is used to measure frequency and amplitude
differences between two signals on the same screen. Delta marker is
used to demonstrate this comparison.
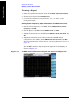
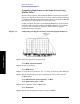
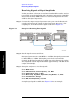
Figure 5-4 An Example of Comparing Signals on the Same Screen
Step 1. Select the spectrum analyzer mode:
Press
Mode, Spectrum Analyzer.
Step 2.
Preset the analyzer:
Press
Mode Preset.
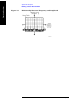
Step 3. Connect the rear panel REF OUT (10 MHz) to the front panel RF input.
Step 4. Set the analyzer center frequency, span and reference level to view the
fundamental and 2nd through fifth harmonics of the 10 MHz reference
signal:
Press
FREQ Channel, Center Frequency, 30, MHz.
Press
SPAN X Scale, Span, 50, MHz.
Press
AMPTD Y Scale, Ref Level, 10, dBm
Press AMPTD Y Scale, Elec Atten, 20, dB or Auto Range (On).
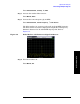
Step 5. Place a marker at the highest peak on the display (30 MHz):