
Technical data

Chapter 5 97
Spectrum Analyzer
Making Distortion Measurements
Spectrum Analyzer
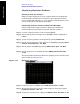
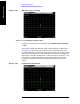
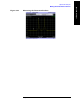
Your display should be similar to Figure 5-20.
Figure 5-20 Harmonic Distortion with 0 dB Attenuation
Step 10. To determine whether the harmonic distortion products are generated
by the analyzer, first save the screen data in trace 2 as follows:
Press
Trace/Detector, Select Trace (2), then Clear Write.
Allow the trace to update (two sweeps) and press
Trace/Detector, Update
Off (View)
, Marker, Delta.
The analyzer display shows the stored data in trace 2 and the measured
data in trace 1.
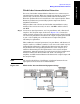
Step 11. Next, increase the RF attenuation by 10 dB: press AMPTD Y Scale, Elec
Atten
, 10, dB. See Figure 5-21.
Notice the ∆Mkr1 amplitude reading. This is the difference in the
distortion product amplitude readings between 0 dB and 10 dB input
attenuation settings. If the ∆Mkr1 amplitude absolute value is
approximately ≥1 dB for an input attenuator change, then distortion is
being generated, at least in part, by the analyzer. In this case more
input attenuation is necessary.