
User`s guide


Agilent 4155C/4156C User’s Guide Vol.2, Edition 6 3-33
Sampling Measurements
Defining Measurement Conditions
To Display Graphics Results
1. Press Display key in the PAGE CONTROL key group.
2. Select DISPLAY SETUP primary softkey.
3. In the DISPLAY MODE field, select GRAPHICS secondary softkey.
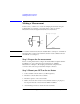
4. In the X axis column, enter variable name, select axis scale, and enter minimum
and maximum values. In the sampling mode, @TIME (time) is entered initially.
5. In the Y1 axis column, enter variable name, select axis scale, and enter
minimum and maximum values.
6. If you use Y2 axis, enter variable name, select axis scale, and enter minimum
and maximum values in Y2 axis column.
When the pointer is in the NAME row, the allowable variable names appear in the
secondary softkey area. To set a variable name, select the desired secondary softkey.
The allowable names are names that you already set up on the CHANNEL
DEFINITION, USER FUNCTION, and USER VARIABLE screens.
To display a grid on the plotting area
In the GRID field, select ON to display or OFF to not display.
To display line parameters on the plotting area
In the LINE PARAMETER field, select ON to display or OFF to not display. Line
parameters are the X and Y intercepts and gradient of the analysis lines.
To display variables on the data variable area
In the DATA VARIABLES fields, select secondary softkey for desired variable. Up
to 2 variables can be displayed on the data variable area which is located between
the graph area and the marker area.
To change resolution of the data to be displayed
In the DATA DISPLAY RESOLUTION field, select NORMAL for the resolution
shown in the specifications, or EXTEND for the ADC full scale resolution. For
example, the data display resolution is 1 fA in NORMAL mode, and 10 aA in
EXTEND mode for 10 pA measurement range.