
User's Manual
Table Of Contents
- Agilent Technologies 16750A/B Logic Analyzer
- Agilent Technologies 16750A/B Logic Analyzer
- Contents
- Getting Started
- Step 1. Connect the logic analyzer to the device under test
- Step 2. Choose the sampling mode
- Step 3. Format labels for the probed signals
- Step 4. Define the trigger condition
- Step 5. Run the measurement
- Step 6. Display the captured data
- For More Information...
- Example: Timing measurement on counter board
- Example: State measurement on counter board
- Task Guide
- Probing the Device Under Test
- Choosing the Sampling Mode
- To select transitional timing or store qualified
- Formatting Labels for Logic Analyzer Probes
- Setting Up Triggers and Running Measurements
- Displaying Captured Data
- Using Symbols
- Printing/Exporting Captured Data
- Cross-Triggering
- Solving Logic Analysis Problems
- Saving and Loading Logic Analyzer Configurations
- Reference
- The Sampling Tab
- The Format Tab
- Importing Netlist and ASCII Files
- The Trigger Tab
- The Symbols Tab
- Error Messages
- Must assign Pod 1 on the master card to specify actions for flags
- Branch expression is too complex
- Cannot specify range on label with clock bits that span pod pairs
- Counter value checked as an event, but no increment action specified
- Goto action specifies an undefined level
- Maximum of 32 Channels Per Label
- Hardware Initialization Failed
- Must assign another pod pair to specify actions for flags
- No more Edge/Glitch resources available for this pod pair
- No more Pattern resources available for this pod pair
- No Trigger action found in the trace specification
- Slow or Missing Clock
- Timer value checked as an event, but no start action specified
- Trigger function initialization failure
- Trigger inhibited during timing prestore
- Trigger Specification is too complex
- Waiting for Trigger
- Analyzer armed from another module contains no "Arm in from IMB" event
- Specifications and Characteristics
- Concepts
- Understanding Logic Analyzer Triggering
- Understanding State Mode Sampling Positions
- Getting Started
- Glossary
- Index
90
Chapter 2: Task Guide
Displaying Captured Data
• In Waveform displays, Timing Zoom and the regular data are in different
windows. To view them together, select Edit -> Insert from the menu bar.
• In Waveform displays, if Timing Zoom and regular data do not correspond,
check that the display is set to Seconds/div. Because Timing Zoom has a
smaller sample period, when the display is set to Samples/div the data
become more divergent the farther from the trigger you scroll.
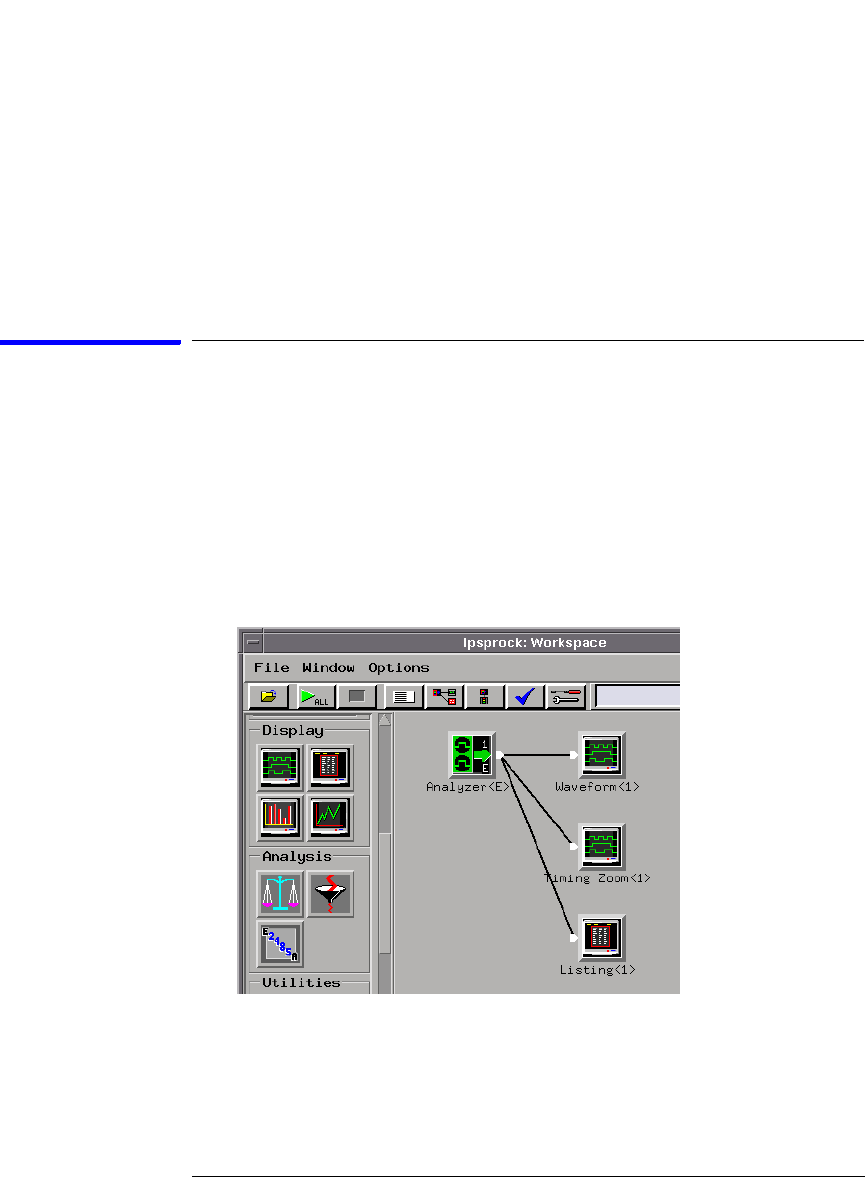
To use other display tools
You can add display tools to your logic analyzer via the Workspace
window.
1. Select the Workspace button (or from the Window menu, select System
and Workspace).
2. In the Workspace window, scroll down to the Display portion of the tool
icon list.
3. Drag the display tool icon and drop it on the analyzer icon.
4. To open the display tool, select its icon and choose the Display command.
You can use the Chart display tool to chart the data on a label over