
Technical data

18
Measurement Tips, Calibration, Traceability, and Measurement Uncertainties
5.1 Measurement Tips
There are four important steps that
are necessary to achieve better power
measurement results:
• Understanding the modulation
formats of the signal under test,
• Understanding the power sensor
technology and operating
principles,
• Understanding the principles of
power measurement traceability,
and
• Selecting the right sensor and PC,
power meter or display for the
signals under test.
These principles are discussed in
detail in Application Note 64–4D,
“4 Steps for Making Better Power
Measurements.”
2
To achive optimum
results in measuring power with
the new USB power sensors, it is
recommended for users to read the
referenced note. Of course, since the
USB sensors feature CW and average
power measurements, we will briefl y
review the above four steps with
regards to the specifi c performance of
their diode-stack sensor confi guration.
Getting to know the performance
capabilities of the diode sensors is
important in order to understand how
they process test signal formats. For
example, do signal crest factors
or peak power spikes cause the
diode sensor to deviate from the
dynamic range square-law detection?
High crest factors can occur in
modern wireless signal formats.
Do the averaging processes inside
the digitizing sensor depend on a
synchronization between the digital-
sampling periods and the digital data
clocks of the wireless signal?
The U2000 Series sensors are based
on the LBS technology, pioneered by
Hewlett-Packard in 1975. Throughout
the last three decades, dramatically
improved products have been
introduced. For example, the U2000
Series is partially based on the diode
confi gurations used in the popular
Agilent E9300-Series wide-dynamic
range average-power sensors. An
extensive technical description of the
E9300-Series diode technology is given
in AN 1449–2. [Ref: 1.2, page 24 — 29]
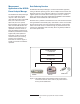
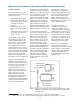
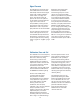
To achieve the expanded dynamic
ranges (–60 to +20 dBm), diode stacks
are incorporated in place of single
diodes, to extend the square-law
conversion range to higher power
levels (+20 dBm in this case) at the
expense of a little sensitivity (see
Figure 23). For example, a series
connection of (m) diodes results in a
low-level sensitivity degradation of 10
log (m) dB. But, (m) diodes provide
an extension upwards in power limits
of the square-law detection region
maximum power of 20 log (m) dB.
This yields a net improvement in
square-law dynamic range of 10 log
(m) dB, compared to a single diode
confi guration.
The U2000 Series sensors are
implemented as a modifi ed barrier
integrated diode (MBID) on one chip
3
,
with a 1-diode balanced pair for the
low power path (–60 dBm to –10
dBm), a 30 dB-resistive divider
attenuator and a 2-diode stack pair for
the high power path (–10 dBm to +20
dBm), as shown in Figure 6.
The U2000 Series sensors’
architecture is based on a data-
compensation algorithm that is
calibrated and stored in an individual
SDRAM resident in each sensor. The
data algorithm stores the information
of three parameters, input power level
vs. frequency vs. temperature for the
range of 9 kHz to 24 GHz and –60
dBm to +20 dBm and 0°C to 55°C,
depending on the model number.
Naturally, since the U2000 Series
is self-contained and requires a
substantial internal circuitry to achieve
digital conversion and measurement
communication on the USB bus, the
SDRAM and Flashdrive memory
technologies exhibit a non-volatile-
type data storage.
Figure 23 The RF/microwave diode stacks are super-integrated onto a single
MBID which combines channel switching and the on-board power
zeroing function.
RF Input
High-Power Path
(–10 to +20 dBm)
Low-Power Path
(–60 to –10 dBm)
2 Refer to Agilent 4 Steps for Making Better Power Measurements, Literature Number 5965-8167EN
3 Refer to Zurakowski, M, et al, Nov, 1986, Diode Integrated Circuits for MM Applications, Hewlett-Packard Journal.